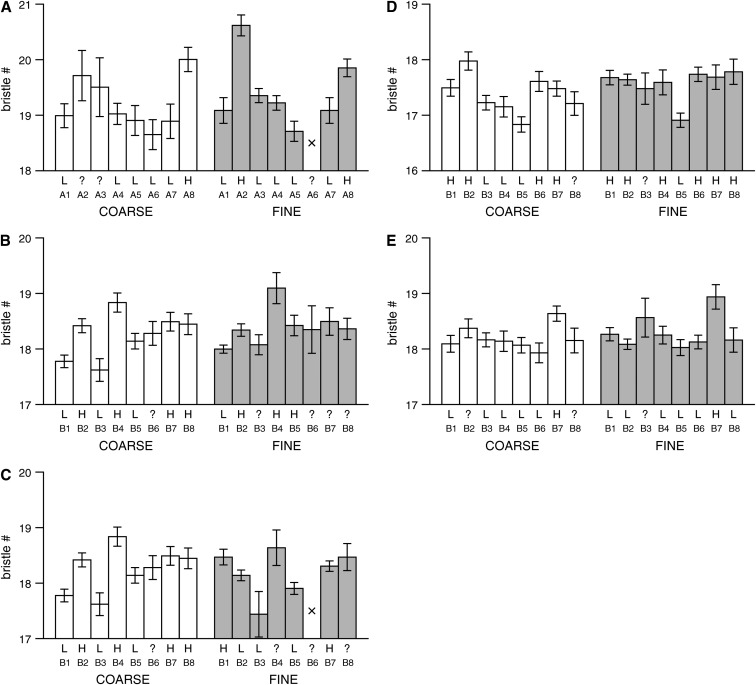
Figure 6.—
Estimated phenotypic means for each of the founder chromosomes at QTL. Each plot represents a single male bristle number QTL (see Figure 5 and Tables 4 and 5 for details) and shows the estimated phenotypic mean (standard error) at the QTL peak for each of the eight lines used to found the particular synthetic population. The line numbers, A1–A8 and B1–B8, refer to the lines described in Table 1. For comparison the means estimated at the QTL peak are presented for both the coarse- (open bars) and fine-mapping (shaded bars) panels. Bars are presented only if the estimated number of experimental individuals consistent with having a given founder chromosome is >10; otherwise a cross is plotted. Below the bars we give the most probable QTL allele harbored by the founder (L, low allele; H, high allele), under the assumption that the QTL is biallelic. If the founder cannot be confidently (probability > 0.95) assigned an allele, a ? is applied. (A) QTL1 for pA male SBN mapped to the X-tip region in population pAr1, (B) QTL2 for pB male SBN mapped to the X-tip region in pBr1+2 (coarse mapping) and pBr1 (fine mapping), and (C) QTL3 for pB male SBN mapped to the X-tip region in pBr1+2 (coarse mapping) and pBr1 (fine mapping). The coarse-mapping information for QTL2 and QTL3 is identical, as these are the two fine-mapped QTL we detected under a single coarse-mapped peak. (D) QTL4 for pB male ABN mapped to the X-middle region in pBr1+2 (coarse mapping) and pBr1 (fine mapping), and (E) QTL5 for pB male SBN mapped to the X-middle region in pBr1+2 (coarse mapping) and pBr1 (fine mapping).

