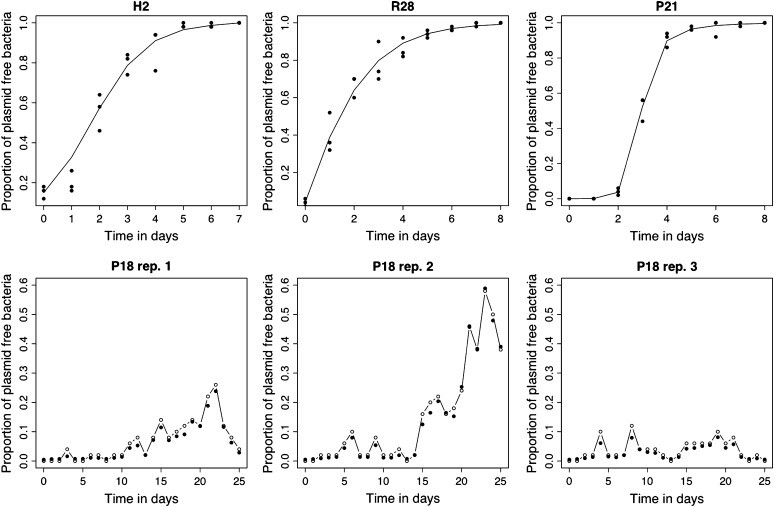
Figure 2.—
For each of four bacterial strains (H2, R28, P21, and P18) the data (solid circles) and the estimated model trajectories (lines) are plotted. (Top) Maximum-likelihood observation error fit of the dynamic Equation 1 for H2 and R28 and Equations 4 and 5 for P21. There, it is assumed that the underlying trajectories obey a deterministic dynamic equation (solid line) and that any deviation from that trajectory seen in the data (solid circles) is attributed to sampling error. (Bottom) A process noise plus observation error fit for each of the three replicates of strain P18. The model parameters were estimated using the three replicates simultaneously and are presented separately with a different vertical scale for clarity. In each case, the open circles joined by a solid line show the observations and the solid circles represent the location of the underlying estimated trajectory (the Xt process) from which the observations were assumed to be drawn.

