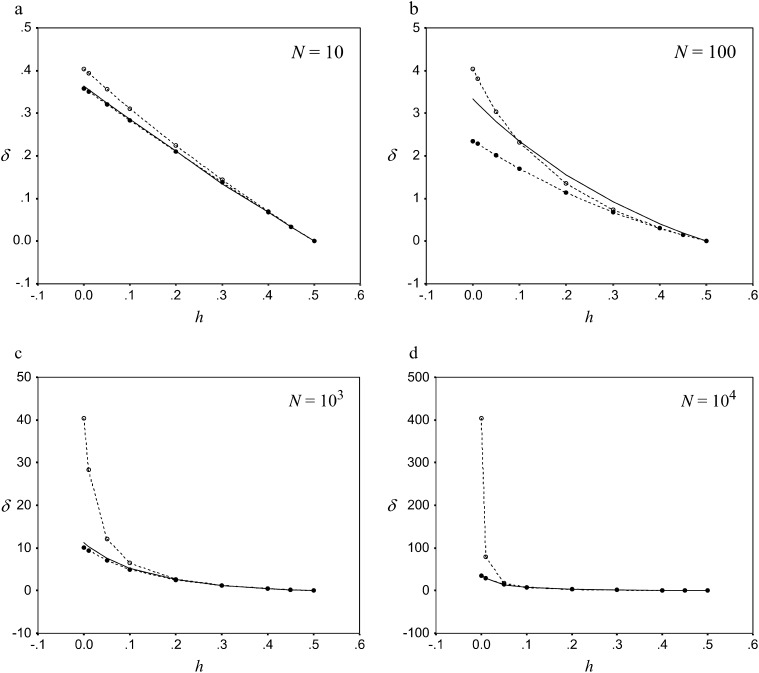
Figure 1.—
Equilibrium rates of inbreeding depression against the coefficient of dominance h. Diffusion predictions (solid line), Equation 13 predictions (dashed line with solid circles), and Equation 13 prediction assuming K = 0 (dashed line with open circles) are shown. In all cases s = 0.02 and λ = 1 for different effective population numbers: (a) N = 10, (b) N = 100, (c) N = 103, and (d) N = 104).

