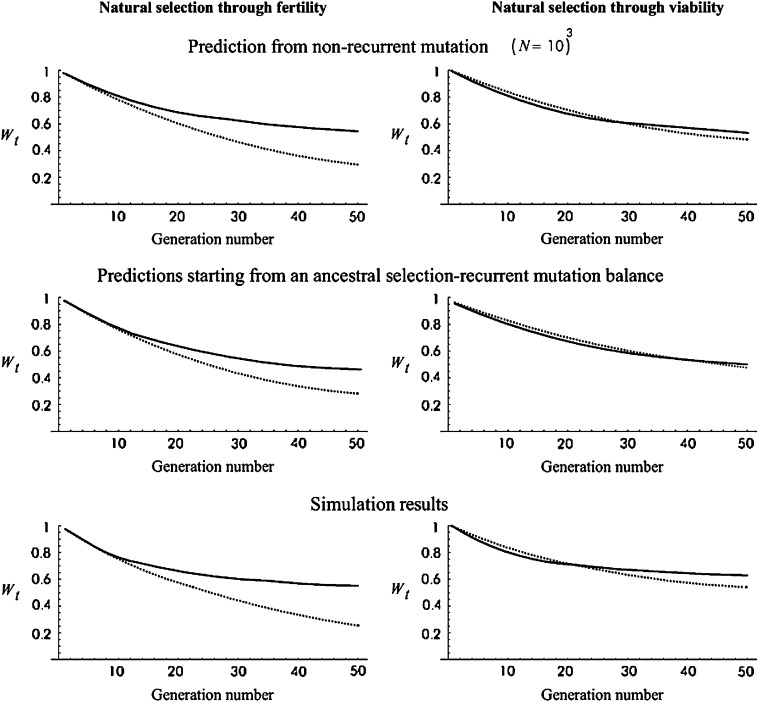
Figure 6.—
Fitness average against generation number for the case simulated by Fernández and Caballero (2001): (50 shift generations for N′ = 25) predictions and simulation results. Solid lines, no management (NM); dotted lines, equal contribution (EC). Simulation results are from Fernández and Caballero (2001).

