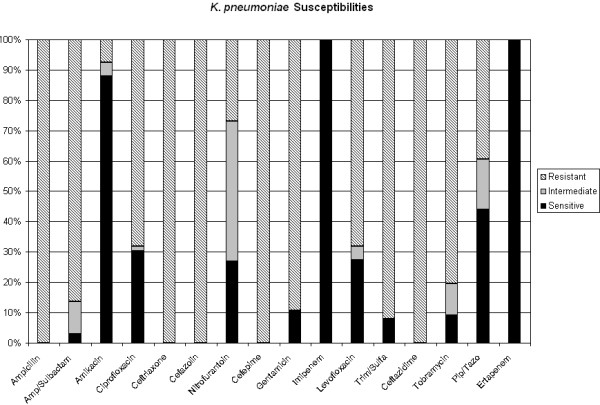
Figure 3.

ESBL K. pneumoniae susceptibilities to ertapenem and other antibiotics. Solid black represents percentage of isolates sensitive to antibiotics. Light gray represents percentage of isolates intermediately sensitive to antibiotics. Diagonal lines represent percentage of isolates resistant to antibiotics.
