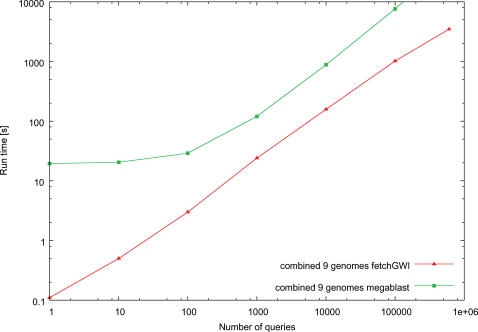
Figure 3. Runtime comparisons on multiple genomes.
Runtime comparisons between fetchGWI (using a compressed index file) and megablast. Each point is computed from the average of three runs on the combined genome of 9 species (human, mouse, honey bee, cattle, dog, drosophila, zebrafish, chimp, and rat) with different input data, except the last run done on the whole dataset. Only perfect matches were sought.

