
Figure 1.
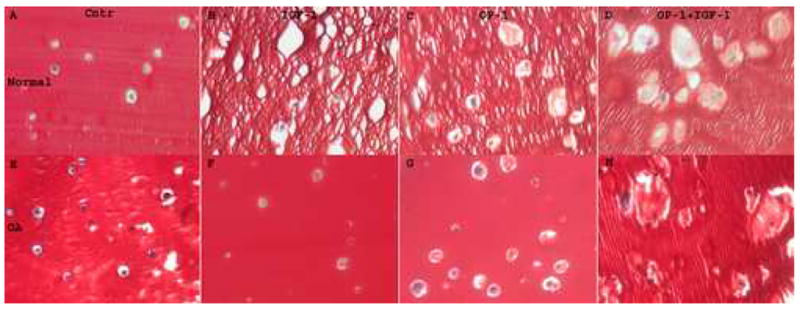
Safranin O staining of normal (A–D) and OA (E–H) chondrocytes cultured in alginate beads. A & E, Cells cultured in the presence of mini-ITS; B & F, Cells cultured in the presence of IGF-1 (100 ng/ml); C & G, Cells cultured in the presence of OP-1 (100 ng/ml); D & H, Cells cultured in the presence of combined OP-1 and IGF-1. Original magnification 400x.