
Figure 3.
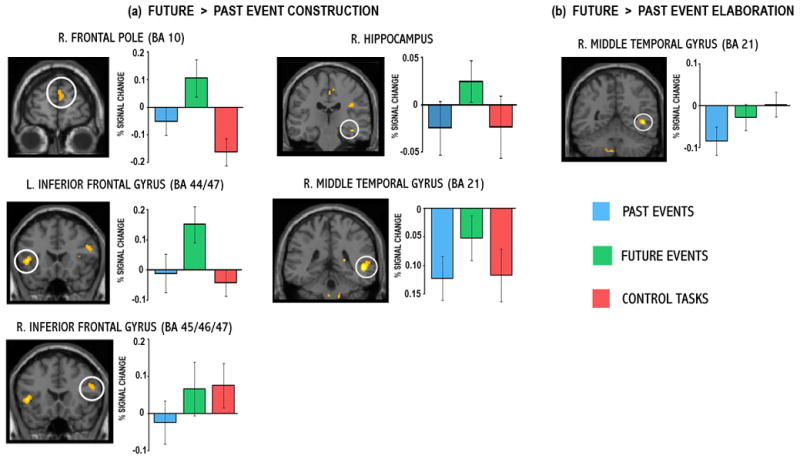
Neural regions showing significant increases in activity during the (a) construction and (b) elaboration of future relative to that of past events. All regions were significant at p < .001, uncorrected (p < .005, uncorrected, for hippocampal and right frontopolar regions of interest). Percent signal change data associated with each of these conditions was extracted from the peak voxels of these clusters (see Table 3 for coordinates) and are plotted. Data from control (imagery and semantic) tasks is also provided. BA = Brodmann area.