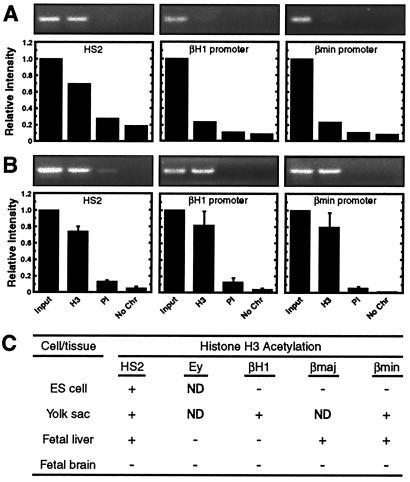
Figure 5.
Developmentally distinct patterns of histone acetylation within the β-globin locus. Histone H3 acetylation of representative β-globin sequences in murine ES cells (A) and 11.5 dpc fetal yolk sac (B). Representative ethidium bromide-stained gels are shown. The graphs show the relative intensity of the PCR products (mean ± SEM). The number of independent determinations for each sequence was two and three for ES cells and yolk sac, respectively. (C) Summary of the developmental and tissue specificity of histone H3 acetylation of the murine β-globin locus.

