
Figure 1.
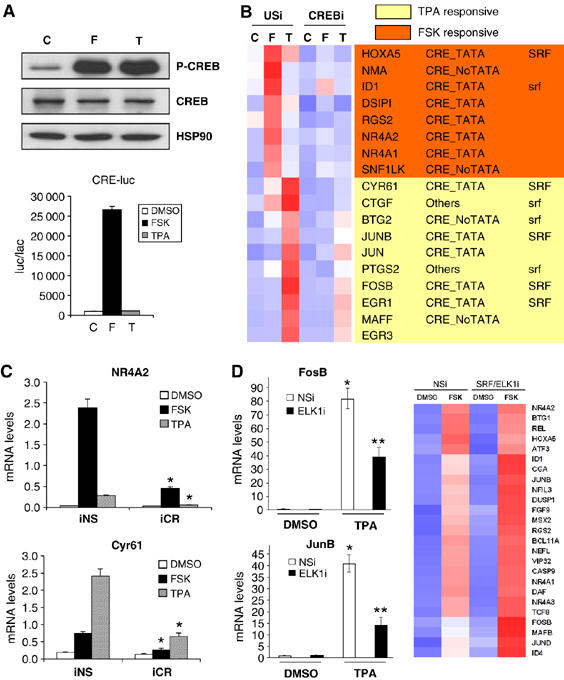
cAMP and stress signals trigger distinct CREB-regulated gene programs. (A) Relative effect of FSK(10 μM, 20 min) and TPA (20 nM, 20 min) on amounts of phospho (Ser133) CREB (P-CREB) (top) and on CRE-luciferase (CRE-luc) reporter activity in HEK293T cells (bottom). (B) Heat map from gene profiling assay of HEK293T cells exposed to FSK or TPA. Effect of CREB knockdown with CREB RNAi shown relative to unspecific (US) RNAi expression vector. Effect of CREB RNAi on amounts of CREB protein shown in Supplementary Figure 1. Presence of conserved (mouse, rat, human) CRE and TATA box (CRE-TATA/ CRE-noTATA); SRF binding sites that are conserved in mouse, rat and human orthologs (SRF) or present only in human (srf) indicated. Gene profiling data provided in Supplementary Table 1. (C) Q-PCR analysis of genes induced selectively by FSK (NR4A2) or TPA (Cyr61) in gene profiling assay. Effect of CREB and nonspecific RNAi (iCR, iNS) on mRNA levels shown. Treatment with FSK, TPA or vehicle as indicated (*significantly different from iNS (P<0.05); n=3). (D) Left: Q-PCR assay showing effect of ELK1 RNAi on mRNA amounts for stress-inducible (FosB, JunB) genes under basal conditions (DMSO) and in response to TPA. Effect of ELK1 RNAi on amounts of ELK1 protein shown in Supplementary Figure 1. Right: heat map from gene profiling assay showing effect of nonspecific or SRF+ELK1 RNAis on expression of CREB target genes in HEK293T cells exposed to FSK as indicated (* and ** differ significantly (P<0.05) and from DMSO (two-way ANOVA; n=3)). Gene profiling data included in Supplementary Table 1.