
Figure 1.
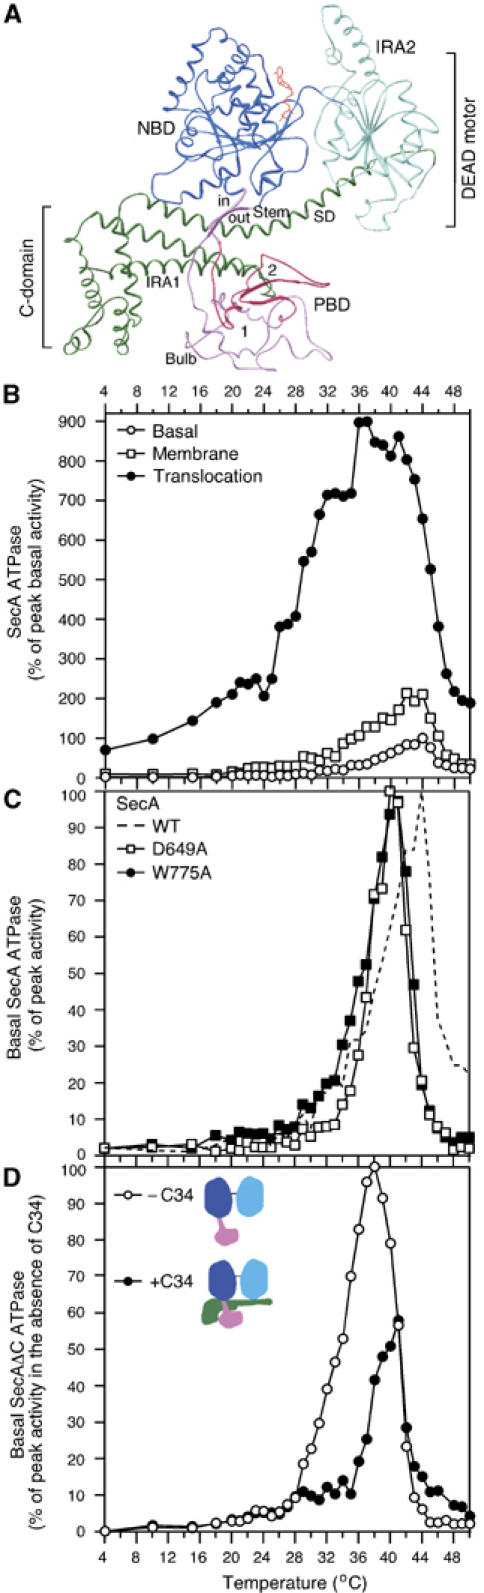
(A) Ribbon representation of ecSecA (Papanikolau et al, 2007). NBD, nucleotide binding domain (blue); IRA2, intramolecular regulator of the ATPase 2 (light blue); PBD, preprotein binding domain (magenta), C-domain (green), ATP (red); SD, scaffold domain. (B) The Kcat values (pmoles Pi/pmol SecA protomer/min) of basal, membrane (urea-treated IMVs; 17 μg protein per milliliter) and translocation (IMVs plus 60 μg/ml proOmpA) ATPase activities of SecA were determined as a function of temperature. The peak Kcat value of basal ATPase was taken as 100% and all other values were expressed as its percentage. Averaged data (n=8) of SecA basal ATPase were used in subsequent graphs. (C) Basal ATPase activities of SecA, SecA(D649A), SecA(W775A) (as in panel B). The peak Kcat value for each ATPase (Supplementary Table 1) was taken as 100% and all other values were expressed as its percentage. (D) Basal ATPase activity of SecAΔC (as in B) in the presence or absence of 10X molar excess of C34 (as indicated). The peak Kcat value for the SecAΔC ATPase (Supplementary Table 1) was taken as 100% and all other values (± C34) were expressed as its percentage. Averaged data (n=12) of SecAΔC were used in subsequent graphs.