
Figure 4.
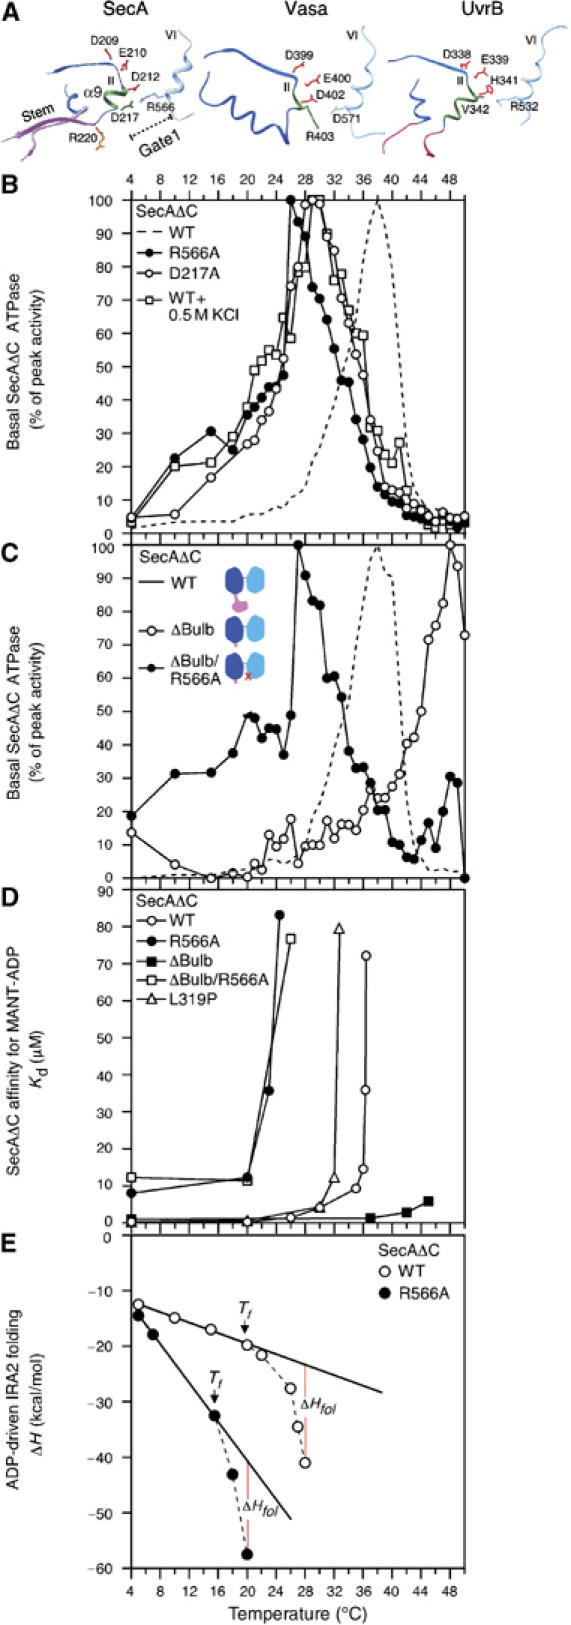
(A) The Gate1 region of ecSecA (Papanikolau et al, 2007) and the corresponding regions in Vasa (Sengoku et al, 2006) and UvrB (Theis et al, 1999). Motif II residue side chains are colored in red. (B) Basal ATPase activities of SecAΔC(R566A), SecAΔC(D217A) and SecAΔC (as in Figure 1D). SecAΔC basal ATPase activity was also determined in the presence of 0.55 M KCl (as indicated). (C) Basal ATPase activities of SecAΔC, SecAΔC(ΔBulb) and SecAΔC(ΔBulb/R566A) (as in Figure 1D). The cartoons (inset) are schematic representations of the three proteins; red cross indicates R566A mutation. (D) Equilibrium dissociation constants (Kd) of SecAΔC and derivatives for the fluorescent analog MANT-ADP plotted as a function of temperature were determined as described (Vrontou et al, 2004). (E) Observed enthalpy change (ΔH) as a function of temperature for the SecAΔC and SecAΔC(R566A) interaction with MgADP (in bufer B with 100 mM KCl). Data were determined using ITC and analyzed as described (Keramisanou et al, 2006).