
Figure 8.
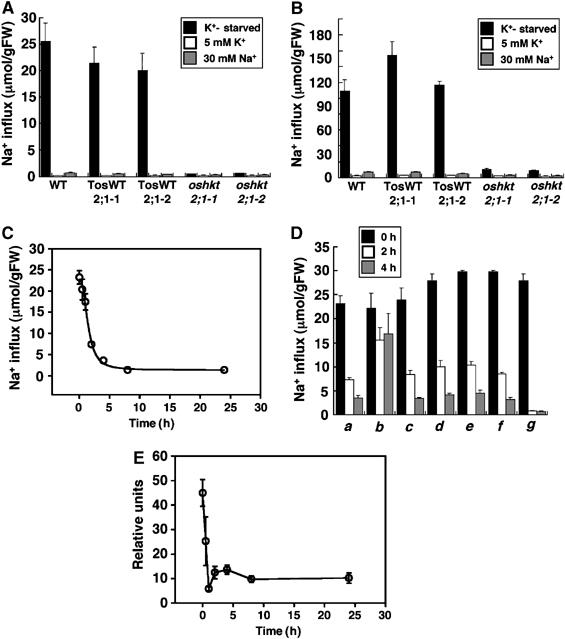
Sodium influx into K+-starved rice roots via OsHKT2;1 is subjected to posttranslational inactivation in response to high external Na+. (A, B) Sodium influx into roots of 10-day-old WT, TosWT2;1-1, TosWT2;1-2, oshkt2;1-1 and oshkt2;1-2, which were grown either in 1 mM CaSO4 solution (black bars), or the same solution supplemented with 5 mM KCl (white bars), or the 1 mM CaSO4 solution supplemented with 30 mM Na+ (gray bars). Sodium influx into roots was monitored at 0.1 mM external Na+ (A) and 1.0 mM external Na+ concentrations (B) (n=3; ±s.d.) 20 min after exposure of roots to the indicated solutions. (C) Time-dependent repression of Na+ influx into K+-starved rice roots via OsHKT2;1 in response to addition of 30 mM NaCl (n=3; ±s.d.). (D) Repression of OsHKT2;1-mediated Na+ influx in response to inhibitors. Sodium influx into roots of 10-day-old WT plants grown in 1 mM CaSO4 solution (0 h black bars) or plants incubated with the indicated test solutions for 2 h (white bars), or plants incubated with test solutions for 4 h (gray bars) are shown. Solutions contained (a) 30 mM NaCl, (b) 30 mM N-methyl-D-glucamine–Cl, (c) 30 mM NaCl and 0.1%DMSO, (d) 30 mM NaCl and the proteasome inhibitor MG132 (50 μM), (e) 30 mM NaCl and actinomycin D (20 μg/ml), (f) 30 mM NaCl and the translational inhibitor cycloheximide (100 μM), and (g) 30 mM NaCl and 5 μM K252a. Time-dependent sodium influx into roots shown in (C, D) was monitored at 0.1 mM external Na+ (n=3; ±s.d.). (E) Time-course expression analyses of the OsHKT2;1 mRNA in roots in response to 30 mM NaCl by quantitative real-time RT–PCR. Expression levels of OsHKT2;1 were monitored at 0, 0.5, 1, 2, 4, 8 and 24 h after the addition of 30 mM NaCl. The OsHKT2;1 expression level of plants grown in 1 mM CaSO4 solution supplemented with 30 mM KCl was also analyzed as a reference of basal OsHKT2;1 expression. All data were normalized to the level of the constitutively expressed OsSMT3 mRNA expression. OsHKT2;1 mRNA levels are plotted relative to the basal OsHKT2;1 expression level. Data at each time point show the average±s.e. of four independent experiments.