
Figure 1.
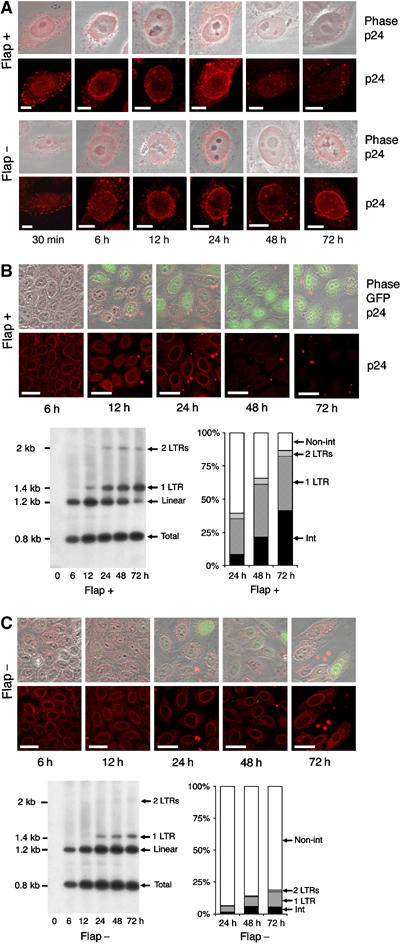
Disappearance of CA proteins at the nuclear membrane correlates in time with nuclear entry of linear vector DNA. (A) Fluorescence confocal microscopy images of incoming CA proteins with time following transduction. P4 cells were transduced with TRIP Flap+ vector, HR Flap− vector. Lower panels show p24 staining and upper panels merge images of p24 staining with phase contrast. The thickness of confocal images is 0.8 μm. Scale bars=3 μm. (B and C) Correlated Southern blotting and immunofluorescence studies. Bottom left-hand panels show intracellular vector DNA profiles following transduction by Southern blot analysis using a vector-specific probe (Zennou et al, 2000). P4 cells were transduced with equal amounts of TRIP-GFP (B) or HR-GFP (C) vector normalized on p24 contents of the supernatants. Bottom right-hand panels show the phosphorimager quantification of intracellular vector DNA forms expressed as percentage of total vector DNA (Zennou et al, 2000). Upper images are the immunofluorescence images (merge of 4 confocal slices) obtained in parallel of the Southern analysis, showing p24 staining and a merge of p24 staining, phase contrast, and GFP expression. Scale bars=10 μm.