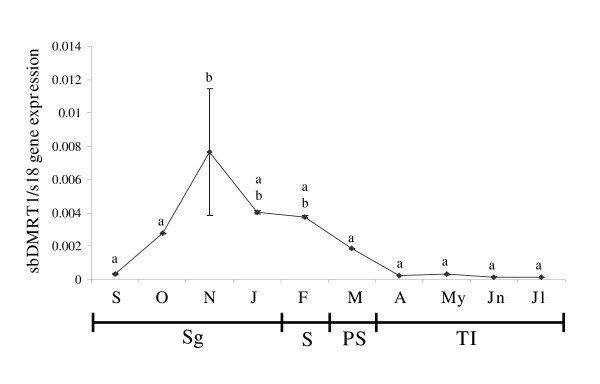
Figure 5.
DMRT1 gene expression in the gonad. The mRNA levels of DMRT1 were studied by real-time RT-PCR in the gonad at the indicated month. Data represent means ± SEM of triplicate samples. Total mRNA were obtained after mixing the same amount of mRNA from 4–5 fish/month. Different letters denote statistically significant differences between the groups according to a Student-Newman-Keuls test. Sg, spermatogenesis; S, spawning; PS, post-spawning; TI, testicular involution.

