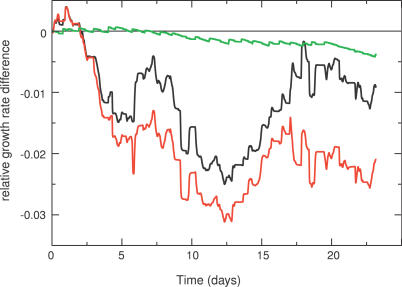
Figure 5. Growth Rate of the Two Promoter Functions in Both Models.
Here we report the growth rate difference compared with the promoter function with the low repressed transcription rate in the deterministic model. Black, promoter function with the high repressed transcription rate in the stochastic model. Red, promoter function with the low repressed transcription rate in the stochastic model. Green, promoter function with the high repressed transcription rate in the deterministic model.

