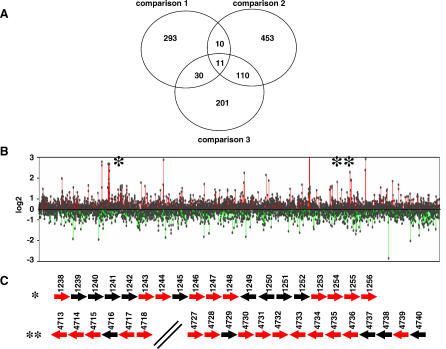
Figure 4. Whole M. smegmatis Genome Microarray Analysis.
(A) Venn diagram showing statistically significantly upregulated genes in each of the three experimental comparisons. Comparison 1, expression of NJS20 compared to that of the Δlsr2 strain NJS22; comparison 2, expression of NJS20 compared to that of NJS20 cultured in EMB; comparison 3, expression of NJS20 compared to that of NJS22 (both cultured in EMB).
(B) Expression levels of all genes in the M. smegmatis chromosome in comparison 1. Each dot corresponds to a single open reading frame.
(C) Magnification of two sections within the M. smegmatis genome (*, region 1; **, region 2 in [B]) that contain clusters of upregulated genes. All genes are represented by arrows; red arrows correspond to genes that are significantly upregulated in condition 1, black arrows correspond to genes that are not significantly upregulated in condition 1.

