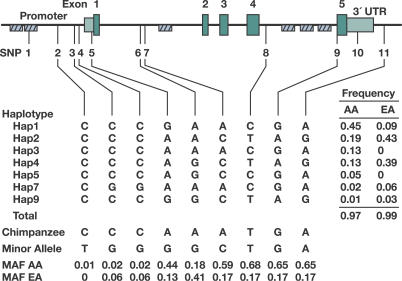
Figure 1. Gene Map, SNPs, and Haplotypes in the Human PPIA on Chromosome 7p13.
Coding exons are marked by green blocks, and 5′ and 3′ UTRs by light green blocks. Hatched black boxes represent Alu repeats. Haplotype structure and frequencies are shown in the middle panel. The corresponding nucleotides in the chimpanzee and allele frequencies of the SNPs are presented in the bottom panel. MAF, minor allele frequency of SNPs (based on EA frequency).

