Figure 6.
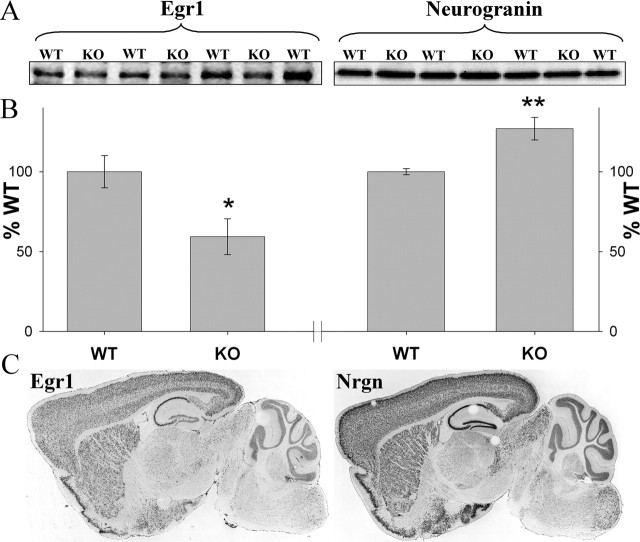
Validation of microarray results. A, B, Western blot results for two proteins from cortical tissue: Egr1 and neurogranin (Nrgn). A, Representative gels are shown. B, Comparison of knock-out (KO) and wild-type (WT) mice (*p < 0.05; **p < 0.01). C, ABA images showing similar expression patterns (mRNA) of the two genes in the brain.

