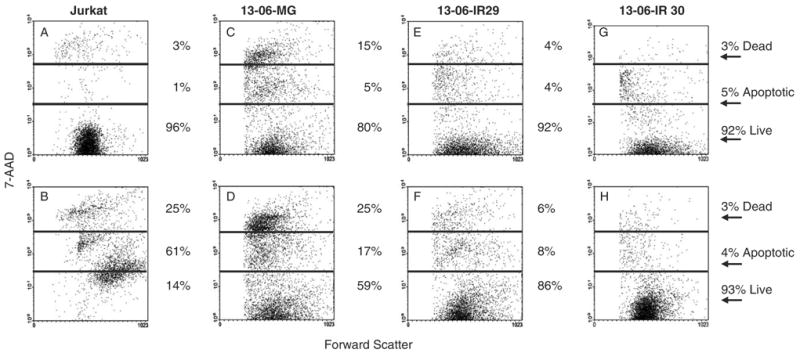
FIGURE 5.

Flow cytometric scattergrams are shown for CFSE-labeled tumor cells that were (bottom row) or were not (top row) coincubated with FasL positive G10 cells for 18 hours at a 5:1 E:T ratio. The percentages of cells that were live, apoptotic, or dead (late apoptotic/necrotic) are given. A, Fas positive Jurkat cells, (B) Jurkat+G10 cells, (C) 13-06-MG cells, (D) 13-06-MG+G10 cells, (E) 13-06-IR29 cells, (F) 13-06-IR29+G10 cells, (G) 13-06-IR30 cells, and (H) 13-06-IR30+G10 cells.
