
Figure 6.
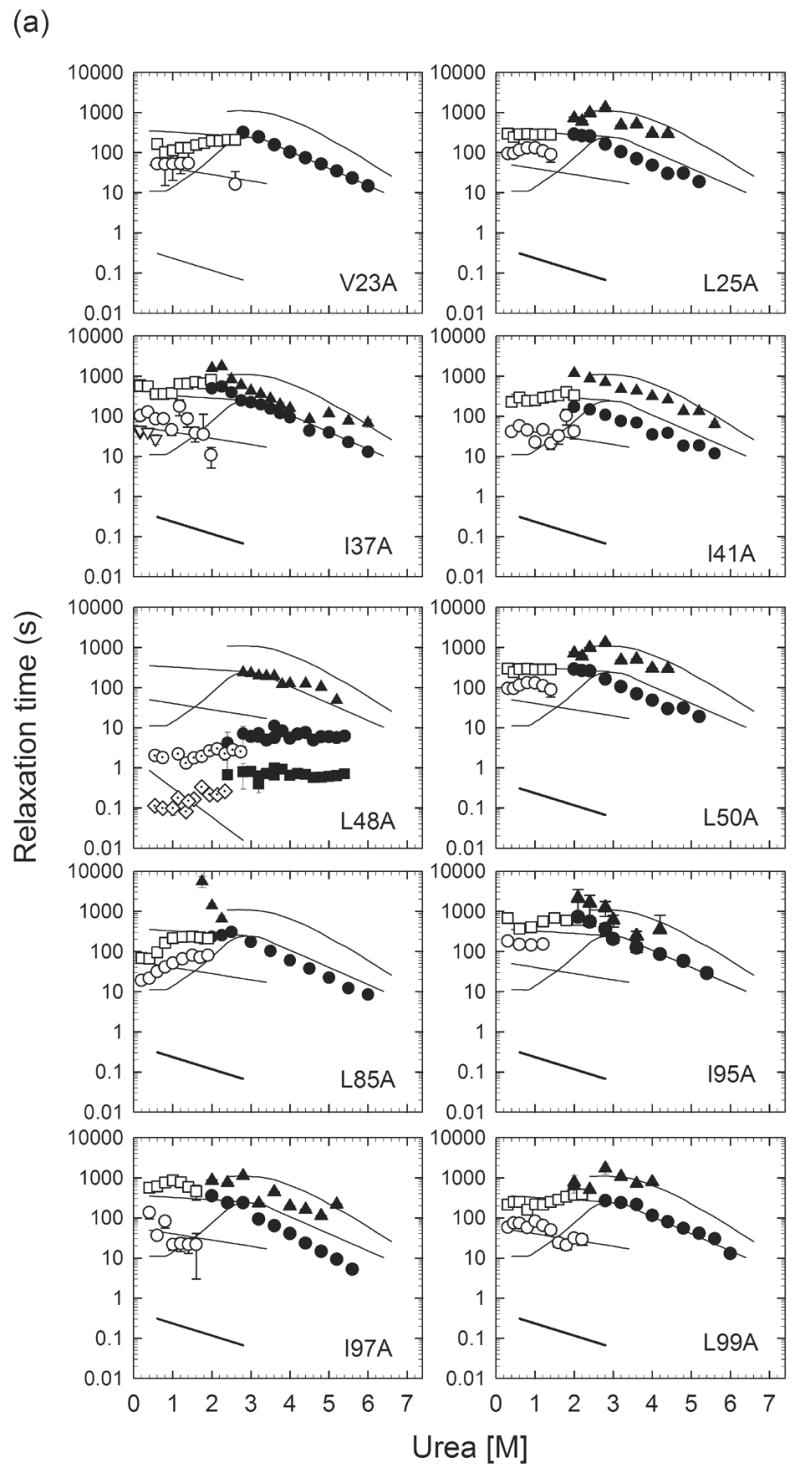
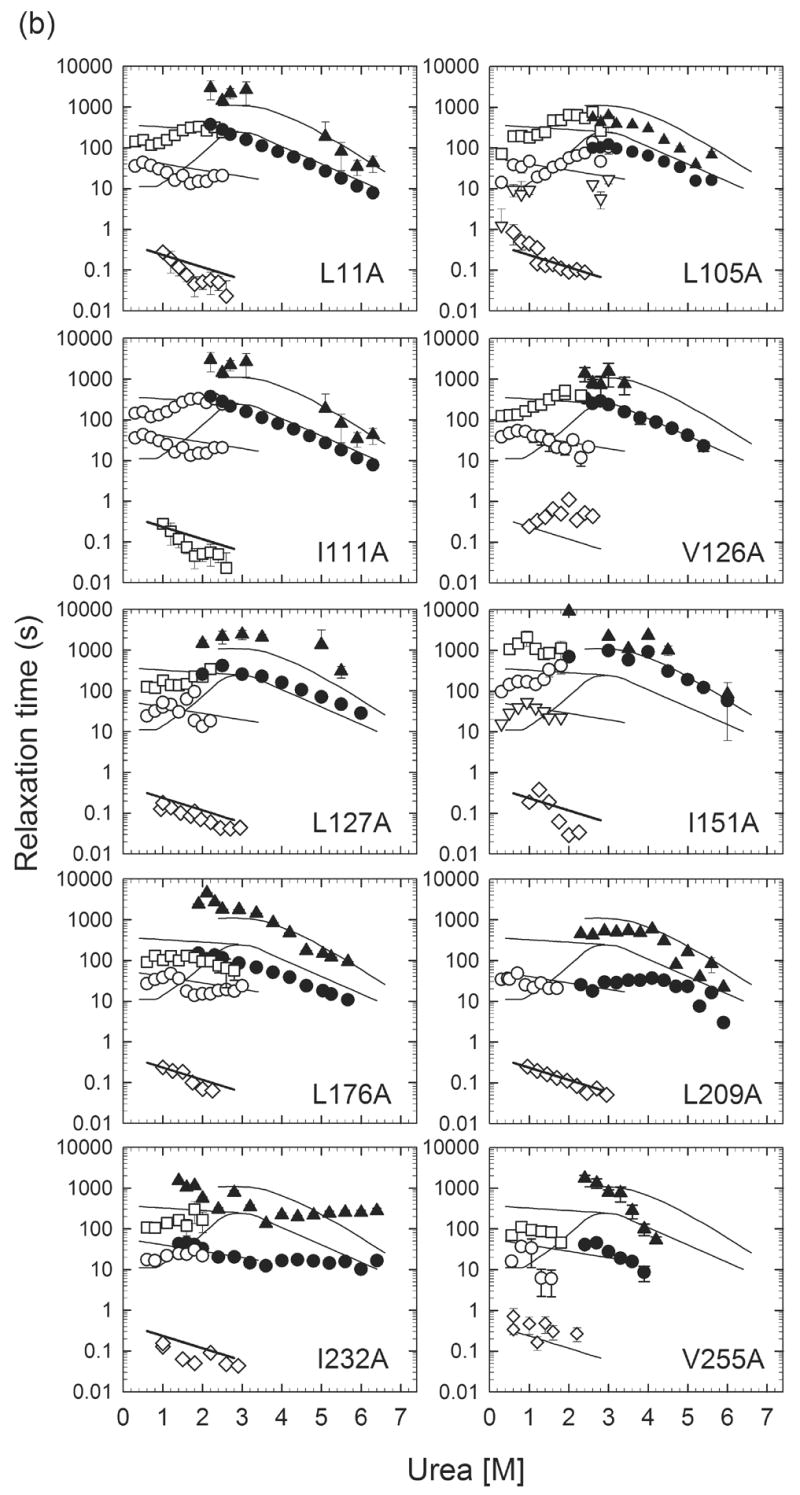
Urea-dependence of the observed refolding phases monitored by manual-mixing CD (○▽□) and stopped-flow fluorescence (◇), as well as unfolding phases monitored by manual-mixing CD (●▲) for (a) Group I αTS variants and (b) Group II αTS variants. The solid lines represent observed relaxation times for wild-type αTS. The diamonds (◇) indicate the behavior of the several hundred millisecond refolding phase corresponding to the unfolding of the off-pathway, burst-phase intermediate. The open triangles (▽), open circles (○) and open squares (□) reflect the fast, intermediate and slow refolding phases attributed to prolyl isomerization. The filled circles (●) and triangles (▲) represent the major and minor unfolding phases. In the case of L48A, the observation of a sub-millisecond phase (◈) reflects the refolding of the I2/U to I1 reaction, based on its continuous linkage with the unfolding reaction of the I1 species (■).