
Figure 1.
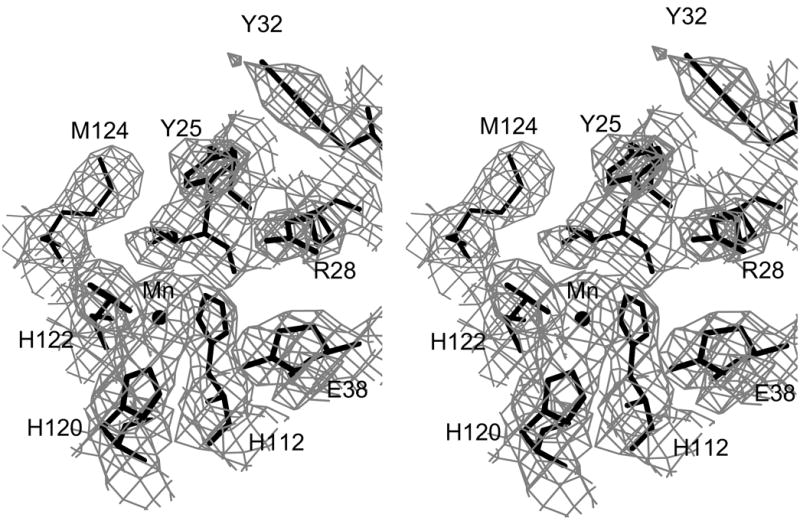
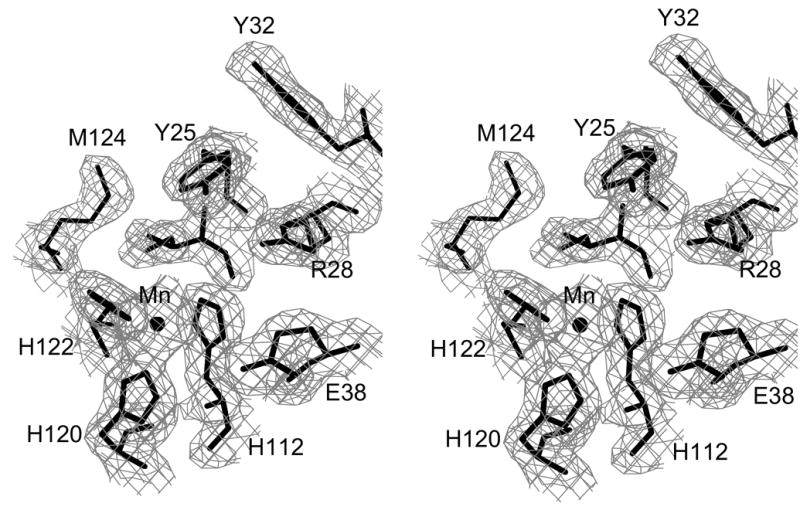
Electron density for minMobA protein. These stereo pictures display several active site residues with (a) a 3.0 Å MAD-phased Fo electron density map and (b) a 2.1 Å SIGMAA58-weighted 2Fo–Fc electron density map; these maps are contoured at 0.8 σ. The active site Mn atom is shown, bound by three histidine residues, along with the catalytic Tyr 25 and other nearby residues.