
Figure 5.
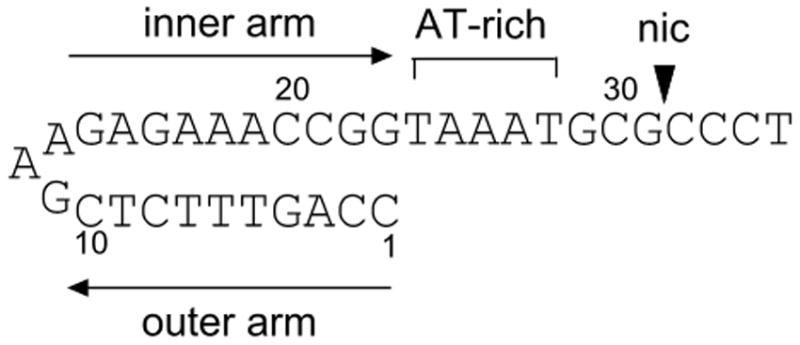
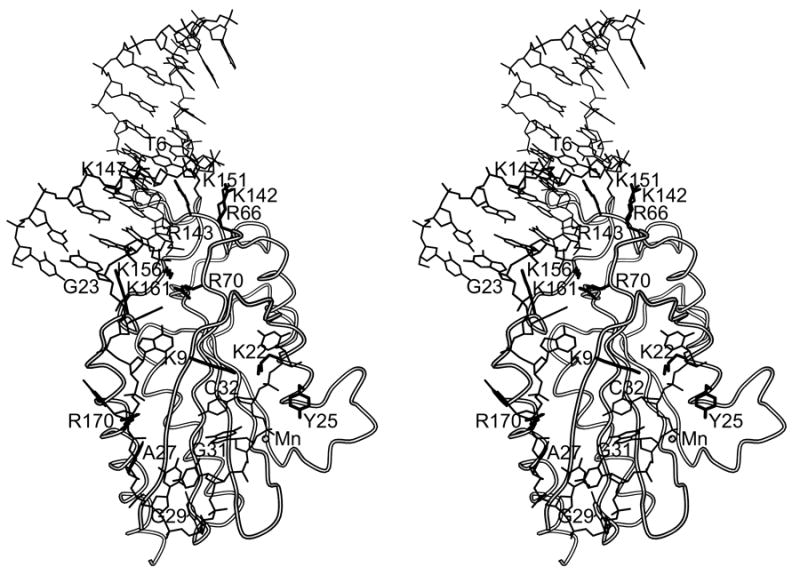
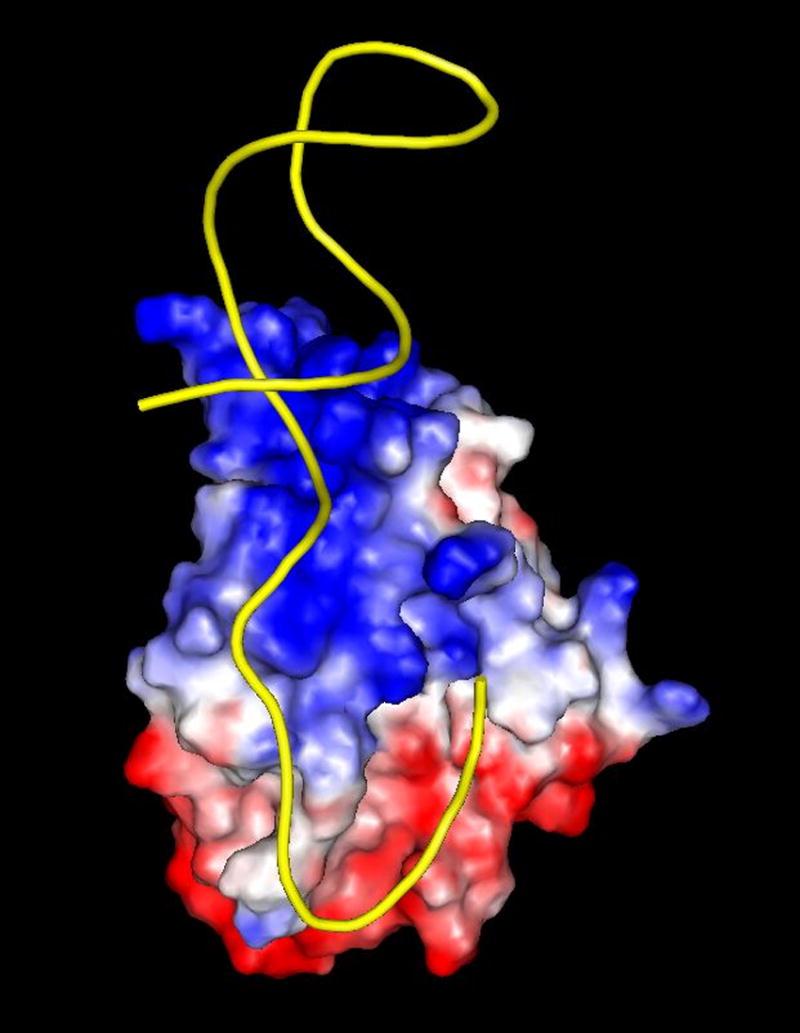
(a) R1162 oriT (b) Drawing of minMobA-33mer model complex. This stereo picture shows the Cα trace of minMobA in a model complex with a 33mer oligonucleotide. The bound Mn atom and catalytic Tyr 25 residue are shown and labeled along with several protein side chains that interact with the DNA in the model complex. Nucleotides mentioned in the narrative are also labeled. (c) Surface electrostatic potential of minMobA. Electronegative charges are shown in red, and positive charges are shown in blue. The bound DNA of the model complex is represented as a trace of the phosphate backbone.