FIGURE 4.
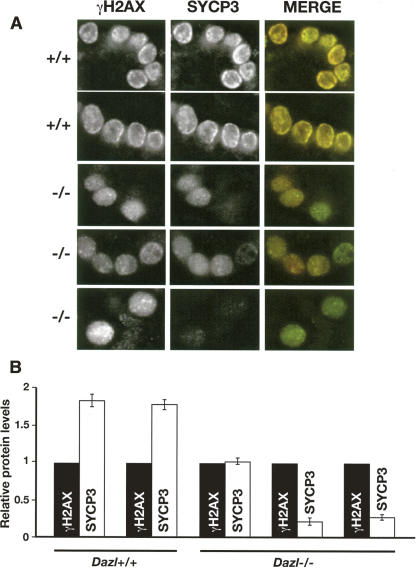
Quantitative immunofluorescence to measure relative levels of Sycp3 protein in germ cells from Dazl +/+ and −/− testes 7 d pp. (A) Representative images taken under identical exposure conditions illustrating heterogenous loss of Sycp3 protein levels in germ cells from Dazl null animals (−/−). In the merged image, Sycp3 is shown in red and γH2AX in green. (B) Pixel intensity was measured at the level of individual cells (40 cells per animal) for both Sycp3 staining and γH2AX, carried out under identical staining and exposure conditions. Sycp3 levels are shown normalized to γH2AX levels for individual animals. Error bars indicate standard error of the mean.

