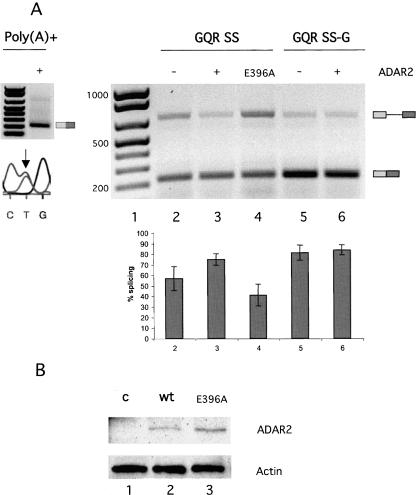
FIGURE 4.
Editing and splicing of the pre-edited GQR SS-G pre-mRNA. (A) (Right) Splicing of the GQR SS and GQR SS–G reporter transcripts analyzed by RT-PCR. The ADAR2 expression vector or the mutant E396A was cotransfected as indicated. (Below) The average percentage of splicing based on three independent experiments. Numbers below the graph corresponds to the lanes above. (Left, top) Cytoplasmic poly(A)+ GQR SS RNA analyzed by RT-PCR; (left, bottom) sequence analysis of the RT-PCR product from the GQR SS transcript above using the reverse primer TA10 exon2B. (Arrow) The Q/R editing site. Editing is seen as a dual C/T peak in the chromatogram, with the C peak representing inosine. (B) Western blot showing the expression level of rADAR2 protein (lane 2) relative to the E396A mutant (lane 3). (Lane 1) Cells were transfected with an empty vector as a control. The level of ADAR2 was normalized to the expression of actin as indicated.

