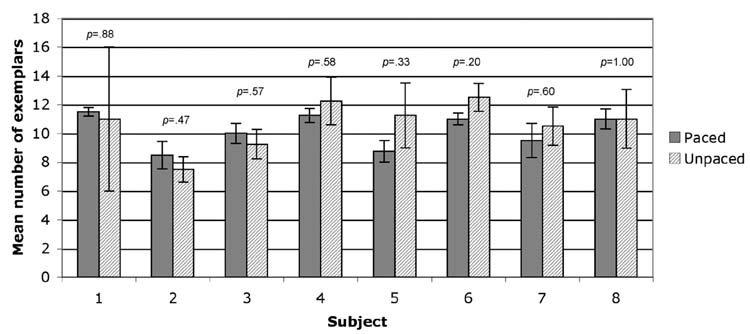
Fig. 1.
Mean number of exemplars generated by each of subjects in the paced overt (solid) and unpaced overt (hatched) conditions. Error bars are standard error of the mean. The inserted p-values result from 2-tailed t-tests performed for each subject comparing exemplars generated in four paced versus four unpaced blocks.

