
Figure 2.
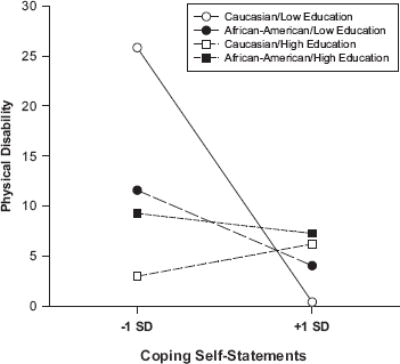
Expected physical disability scores based on race, education, and the use of coping self-statements. Low and high education levels are represented by −1 SD and +1 SD from mean education, respectively. Expected disability scores were calculated on the basis of the regression results presented in Table 4.