
Figure 5.
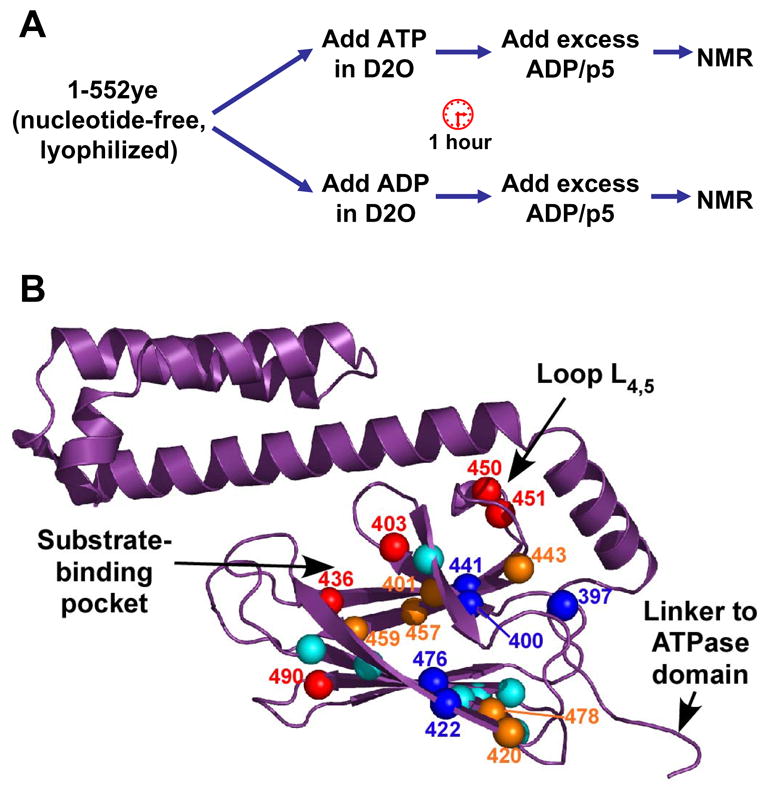
Hydrogen-deuterium exchange (HDX) reveals differential effects of ATP binding in the SBD. (A) Outline of HDX experiment. (B) Peak intensity ratios (IATP/IADP) for the 23 residues that could be quantified are represented on the SBD structure (PDB code 1DKZ). Residues undergoing faster exchange in ATP are indicated by red (IATP/IADP <0.5) and orange balls (IATP/IADP between 0.5 and 0.9). Residues that are more protected in ATP relative to ADP are shown as dark blue balls (IATP/IADP>1.1), and relatively unaffected residues are shown as cyan balls. Figure prepared using PyMOL (http://www.pymol.org).