Figure 3.

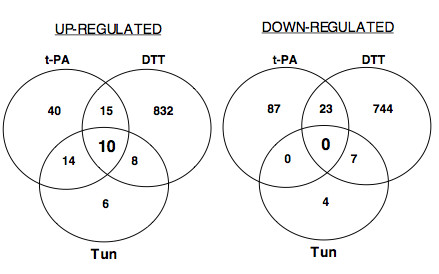
Venn diagrams of the numbers of overlapping and non-overlapping induced (≥ 1.5 fold) or repressed (≤ 1.5 fold) genes on the A. niger array after exposure to DTT or tunicamycin (Tun) and in the t-PA producing strain (t-PA).

Venn diagrams of the numbers of overlapping and non-overlapping induced (≥ 1.5 fold) or repressed (≤ 1.5 fold) genes on the A. niger array after exposure to DTT or tunicamycin (Tun) and in the t-PA producing strain (t-PA).