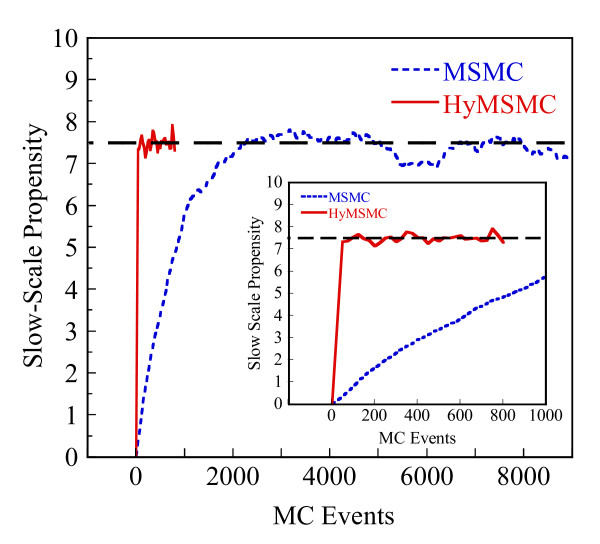
Figure 6.
Comparison of relaxation times of the fast network in network (A1). Evolution of the slow-scale propensity, , of reaction 3 in network (Al) before the occurrence of the first slow event B → C, using the MSMC (dotted line) and the HyMSMC (solid line) methods. The horizontal dashed line shows the slow-scale propensity estimated via an analytical description (binomial PDF) of the QE. A magnified view of the initial period is shown in the inset to highlight the rapid convergence of the slow-scale propensity using the hybrid solver of the HyMSMC method. The parameters are those of Figure 3.

