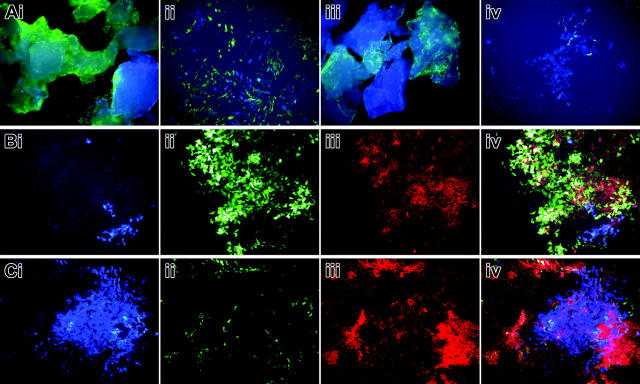
Figure 8.
Primary osteoblast cultures derived from bone chips of a 2.3-green or 3.6-green recipient mouse that received a transplant of calvarial progenitor cells from a 3.6-blue donor. This scenario is as illustrated in Figure 6E-F. (A) Bone chips after 7 days in primary culture and in early secondary culture showing the 2 colors of cells embedded within and growing from the bone fragments. The 3.6-green chips (Ai) show 3.6-green cells on the plate surface. The 3.6-blue cells that grow out from these chips can be appreciated at higher power in the secondary culture (Aii). The 2.3-green chips (Aiii) show the 2 colors of GFP within the bone. No 2.3-green cells are seen in the early outgrowth cells (Aiii-iv) because the transgene is not activated prior to bone nodule formation. At high power in the early secondary culture the 3.6-blue cells are evident (Aiv). (B) Mineralizing bone nodule (Biii) derived from the 3.6-green recipient mouse (Bii) that is adjacent to a cluster of 3.6-blue cells (Bi). An overlay of the 3 images (Biv) shows XO staining of the 3.6-green cells but not the 3.6-blue cells. (C) Fate of a donor-derived 3.6-blue cell cluster (Ci) that is surrounded by host-derived 2.3-green cells (Cii) that are producing a mineralized matrix (Ciii). The overlay image (Civ) shows faint XO staining over the 3.6-blue cells relative to the strong staining over the 2.3-green cells. (A-C) Original magnification, × 100.

