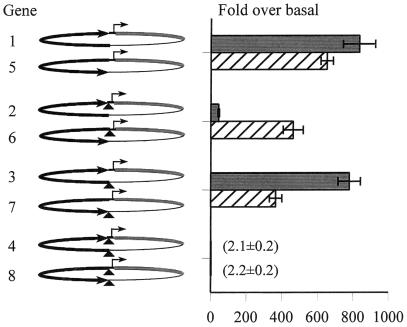
Figure 2.
The ALE displays an orientation preference in transient transformation. Genes (drawn to scale) are displayed as in Fig. 1. The different orientations of ALE are represented by the large curved arrows pointing in opposite directions. The Adh-null, su(Hw)+ strain was used. Gray bars show results for normal orientation of ALE, and striped bars show the results for the reversed orientation of ALE. Values are normalized relative that for the control same gene carrying the λ DNA insert in place of the ALE.

