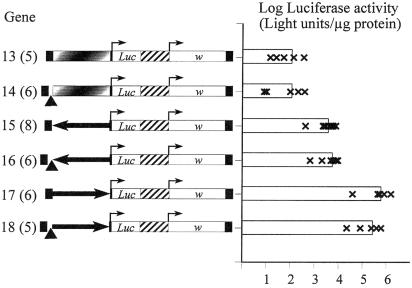
Figure 4.
The ALE displays an orientation preference in a chromosomal context. Genes are drawn to scale. After the gene number, the number of individual transformed lines is given in parentheses. Each construct contains a firefly luciferase gene (Luc) and mini-white gene (w). The small arrows represent the promoters for each gene. Note that the promoter driving luciferase expression in each case is the crippled Adh promoter. The black small boxes flanking each construct represent P-element sequences, and the central, slashed boxes represent plasmid vector sequences. As in previous figures, the gypsy insulator is shown as a small triangle. For genes 13 and 14, the shaded boxes represent a 4.8-kb fragment of λ DNA. For genes 15 through 18, the large arrows pointing to the right represent the normal orientation of ALE, while the ones pointing left represent the reversed orientation of ALE. The graph shows the log10 of luciferase specific activity (light units per μg protein). Each data point shows the mean of three independent samples from a given transformed line. Bars are the grand means of the luciferase specific activities for all the transformed lines for a given gene.

