
Figure 3.
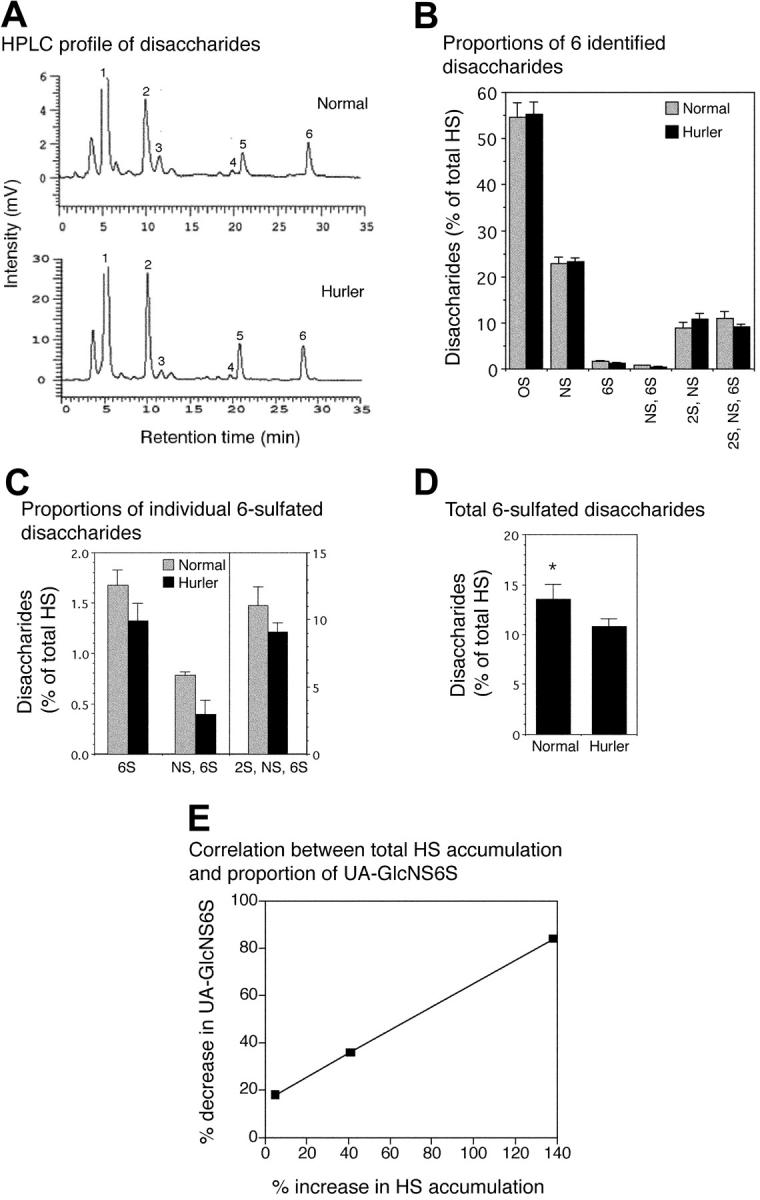
Analysis of disaccharide composition of normal and Hurler MAPC HS. HS from normal and Hurler MAPCs was enzymatically digested and the resulting disaccharides separated by reverse-phase ion pair HPLC. Individual disaccharides were quantified by determining the area under the peaks. n = 3 separate experiments. (A) High-performance liquid chromatography (HPLC) tracing of disaccharides from normal and Hurler MAPCs from one representative experiment. Peak no. 1 (0S): UAGlCNAc; peak no. 2 (NS): UAGlcNS; peak no. 3 (6S): UAGlcNAc6S; peak no. 4 (NS, 6S): UAGlcNS6S; peak no. 5 (2S, NS): UA2SGlcNS; peak no. 6 (2S, NS, 6S): UA2SGlcNS6S. (B) Disaccharide composition of normal and Hurler HS, expressed as percent of total HS. (C) Proportions of the 3 6-sulfated disaccharides in normal and Hurler HS. (D) Total 6-sulfation in normal and Hurler HS. *P < .05. (E) Progressive decrease in proportion of UA-GlcNS6S with increasing total HS accumulation. Correlation coefficient (R) = 0.99. Data in panels B-D are shown as the mean ± standard error (SE).