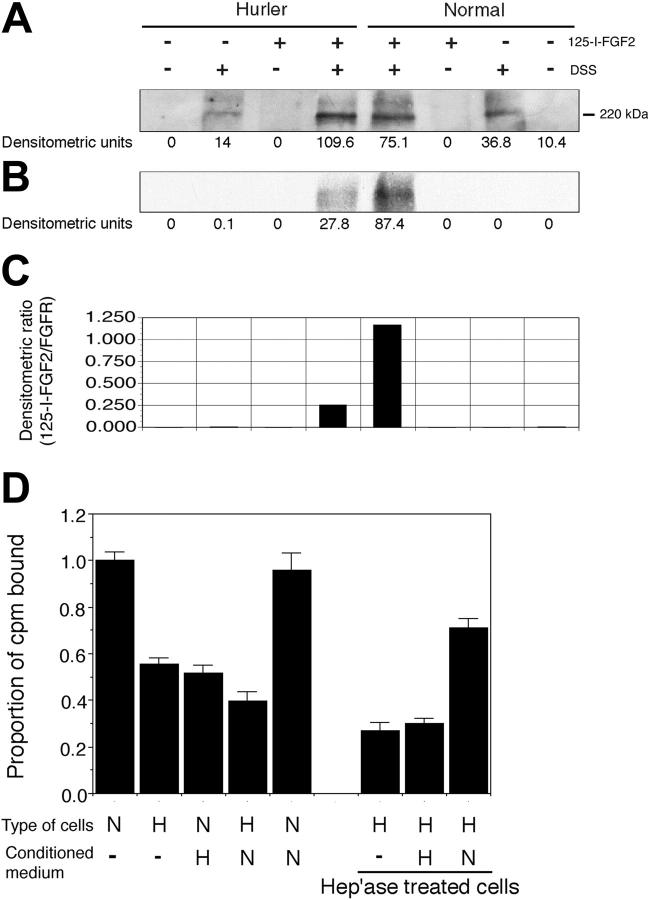
Figure 4.
(A-C) Binding of 125I-FGF-2 to MAPC cell-surface receptors. Binding of 125I-FGF-2 to FGFR1 in presence of cell-surface HS. The binding of 125I-FGF-2 to FGFR1 on normal and Hurler MAPCs was determined as described in “Materials and methods.” Briefly, normal or Hurler MAPCs were incubated with 125I-FGF-2 to induce binding to cell-surface receptors. Cell lysates were prepared and subjected to SDS-PAGE. FGFR1 was visualized by Western immunoblotting, and 125I-FGF-2 by autoradiography. In the control lanes, either 25I-FGF-2, DSS, or both were omitted, as shown. The densitometric intensity of the band in each lane is shown below the respective lanes. (A) Western immunoblotting with anti-FGFR1 antibody, demonstrating comparable expression of FGFR1 by normal and Hurler MAPCs. (B) Autoradiograph of the same membrane for 125I-FGF-2, demonstrating colocalization of FGFR1 and 125I-FGF-2. (C) The extent of binding of 125I-FGF-2 to FGFR1 determined by densitometry was expressed as a ratio of 125I-FGF-2 to FGFR1 (B/A). (D) 125I-FGF-2 binding to cell-surface receptors on normal and Hurler MAPCs. The binding of 125I-FGF-2 to normal and Hurler MAPC monolayers was examined as described in “Materials and methods.” The counts per minute (cpm) bound (specific binding) were corrected for the number of cells in each well, and then expressed as the proportion of cpm bound to normal MAPC/105 cells/well. Data are from 2 to 3 independent experiments with replicates. N: normal; H: Hurler; hep'ase: heparitinases I and III. Significance of differences between conditions is described in “Results.”

