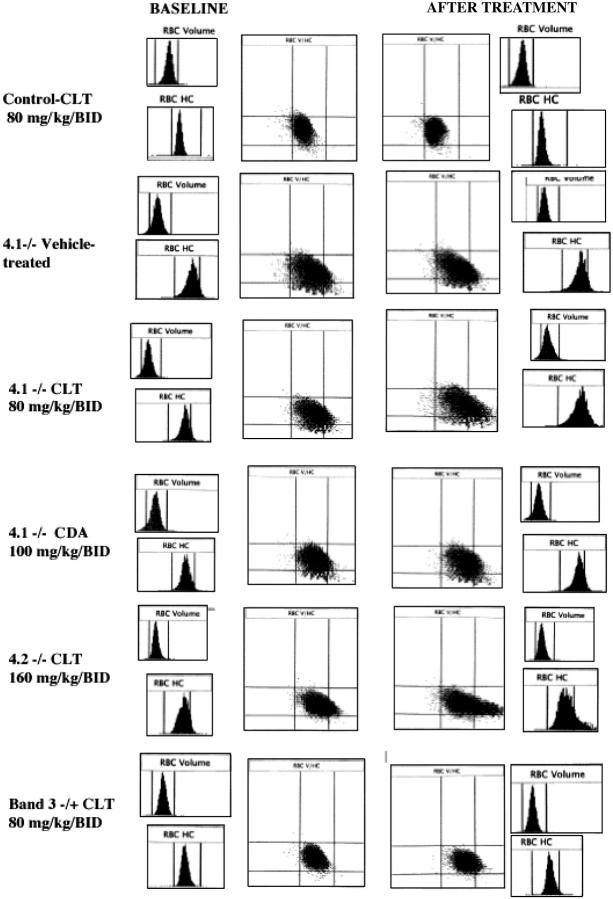
Figure 3.
Histograms for cell volume and cell hemoglobin concentration at baseline and after treatment with Gardos channel blockers. Histograms for erythrocyte volume (RBC volume) and cell hemoglobin concentration (RBC HC) and plot of RBC HC (x-axis) versus RBC volume (y-axis) are presented at baseline (left side) and after the specified in vivo treatment (right side). Rows from top to bottom: control mouse before and after 11 days of treatment with clotrimazole (CLT, 80 mg/kg twice a day); 4.1-/- mouse before and after 11 days of treatment with the vehicle use for drug administration; 4.1-/- mouse before and after 11 days of treatment with CLT (80 mg/kg twice a day); 4.1-/- mouse before and after 7 days of treatment with CDA (100 mg/kg twice a day); 4.2-/- mouse before and after 6 days of treatment with CLT (160 mg/kg twice a day); and band 3+/- mouse before and after 7 days of treatment with CLT (80 mg/kg twice a day). Data obtained with the Bayer ADVIA 120 hematology analyzer. One representative mouse shown for each condition; similar results were obtained for the other animals.

