Figure 1.
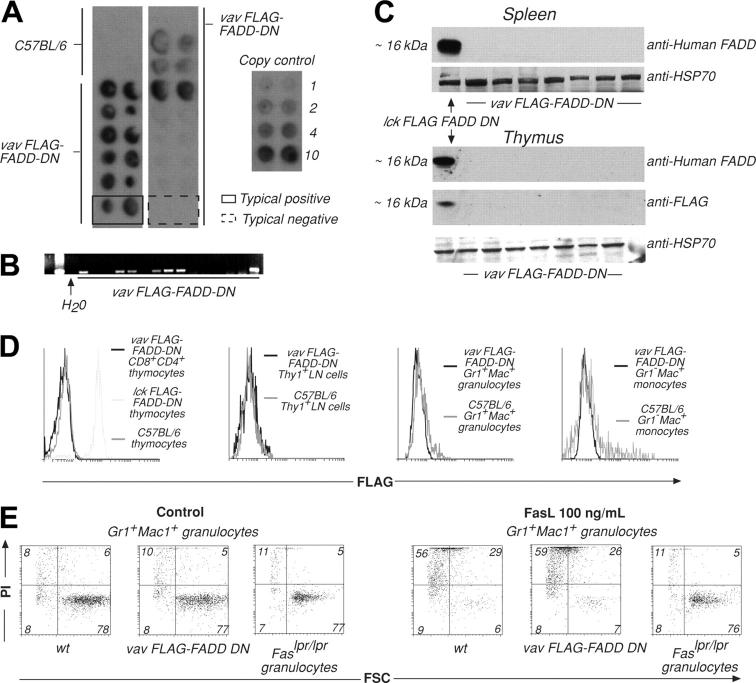
Generation and analysis of VavP–FLAG–FADD-DN transgenic mice. (A) Tail DNA was extracted from primary and first generation VavP–FLAG–FADD-DN transgenic mice. Dot hybridization to a 32P-labeled SV40 probe was used to detect the presence of the transgene. DNA was spotted in duplicate, and transgene copy number can be estimated by comparing intensity of hybridization to that of control SV40 DNA of known concentration. These are typical results with 2 examples highlighting a transgene positive (solid line) and a negative (broken line) mouse. (B) PCR using SV40-specific primers was used to detect transgene sequences in primary transgenic mice or first-generation descendants. Results are representative of multiple screens. (C) Western blots on extracts of 106 cells from spleen or thymus of VavP–FLAG–FADD-DN transgene-positive mice were probed with either anti–human FADD mAb (which recognizes FLAG–FADD-DN) or anti-FLAG mAb. (D) In an alternative method for detecting transgene expression, cells from lymph nodes (LNs), thymus, or bone marrow of VavP–FLAG–FADD-DN transgenic mice were stained with antibodies to Thy1, CD8, CD4, Gr-1, and/or Mac-1, sorted in a FACS machine, fixed, permeabilized, stained with anti-FLAG mAb, and analyzed in a FACScan. Intracellular staining of thymocytes from Lck–FLAG–FADD-DN transgenic mice10 with anti-FLAG mAb was the positive control. Results are representative of multiple screens (> 12 PCR-positive mice). (E) Granulocytes (Mac-1+Gr-1+) were FACS-sorted from bone marrow of VavP–FLAG–FADD-DN transgene-positive progeny and control mice and cultured for 24 hours in medium alone or in the presence of oligomerized recombinant FasL (100 ng/mL). Cell viability was determined by staining with PI and FACS analysis. Numbers in quadrants represent percentages of cells within each staining profile. FSC indicates forward light scatter. Results shown are representative of more than 12 assays.

