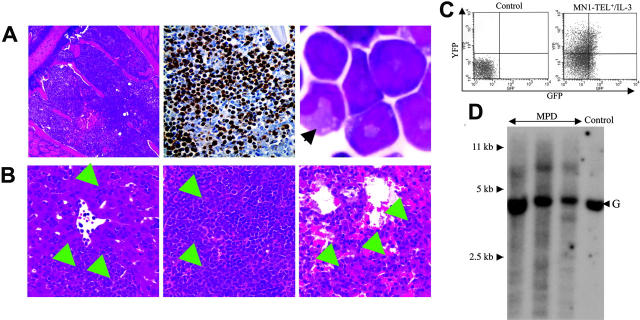
Figure 4.
Characteristics of the myeloproliferative disease induced by coexpression of MN1-TEL and IL-3. (A) Myeloproliferation in mice that received transplants of MN1-TEL+/IL-3 cells. (Left) Hematoxylin-Eosin (H-E) staining of BM; (middle) myeloperoxidase staining of BM; (right) M-G staining of BM cells. An arrow indicates a cell with differentiated morphology. (B) Aggressive organ infiltration by myeloid cells in mice that received transplants of MN1-TEL+/IL-3 bone marrow. H-E staining of liver (left), spleen (middle), and lung (right). Arrows indicate infiltrations of the myeloid cells. Images were obtained as previously described.12 (C) GFP and YFP expression in BM cells from mice that received transplants of MN1-TEL+/IL-3 cells. FCM analysis was performed as described in Figure 3A. (D) Clonality of MN1-TEL+/IL-3+ myeloproliferative disease (MPD). Genomic DNA of MPD BM cells was digested with BglII and hybridized with an Il3 probe. Control indicates untransduced BM; and G, germ line band.

