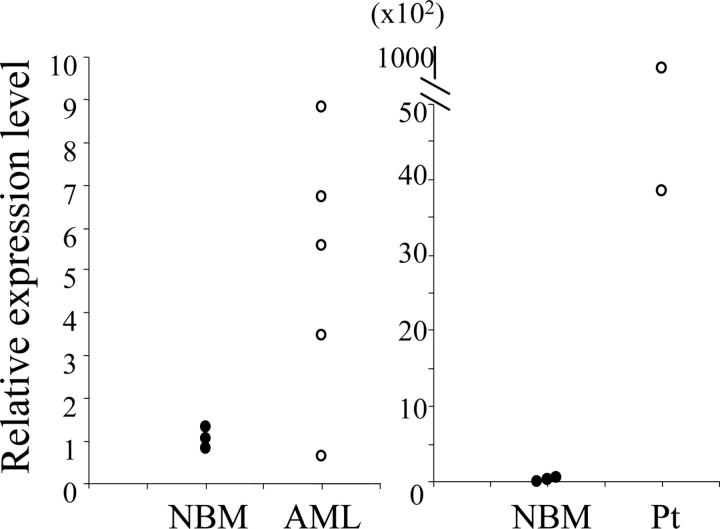
Figure 7.
Elevated expression of N-Myc in human and mouse MN1-TEL+/HOXA9+ AML. A quantitative RT-PCR result is shown. (Left) Expression of N-Myc mRNA in mouse MN1-TEL+/HOXA9+ AML cells (BM); (right) expression of N-MYC mRNA in 2 human MN1-TEL AML patient samples. NBM indicates control normal BM (n = 3); and Pt, patient samples (n = 2).

