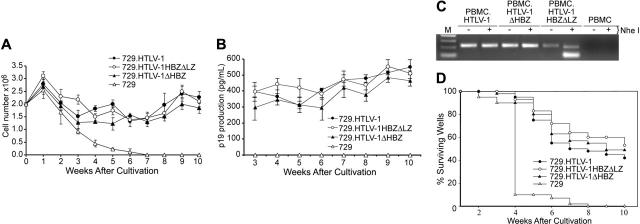
Figure 5.
HTLV-1 T-lymphocyte proliferation and immortalization assays. PBMC (2 × 10⁶) donor cells were cultured with (106) irradiated producer cells as indicated in 24-well plates. (A) Representative growth curve is presented showing cell viability at weekly intervals. The mean and standard deviation of each time point was determined from 3 random independent samples. (B) HTLV-1 gene expression was quantified by detection of Gag protein in the culture supernatant using ELISA. (C) The HTLV-1 genome fragment containing the HBZ coding region was amplified by PCR from DNA of immortalized PBMCs as indicated (HTLV-1HBZΔLZ DNA was cut by NheI). (D) Prestimulated PBMCs (104) were cocultured with 2000 irradiated 729 stable producer cells in 96-well plates. The Kaplan-Meier plot shows the percentages of proliferating wells as a function of time (weeks). Results indicated that the percentage of wells containing proliferating lymphocytes was similar between wtHTLV-1 and HBZ mutant viruses.

