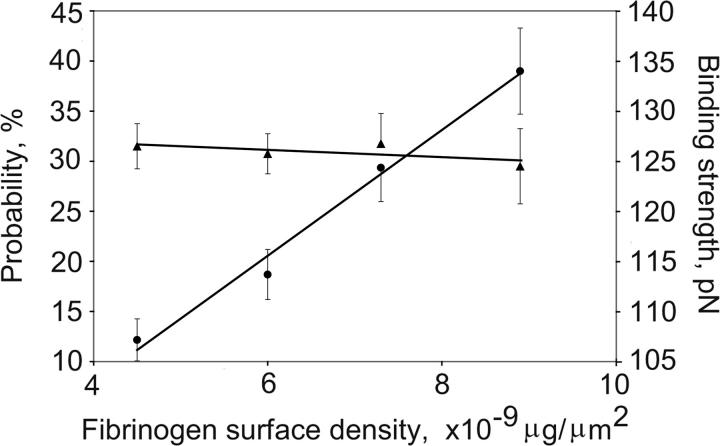
Figure 3.
DesA-NDSK/fibrinogen binding probability and strength plotted against the fibrinogen surface density. The fibrinogen surface densities were nonsaturating in this range, and the binding probabilities (•) increased linearly, whereas the binding strengths (▴) remained unchanged. Error bars indicate standard deviation.

