
Figure 3.
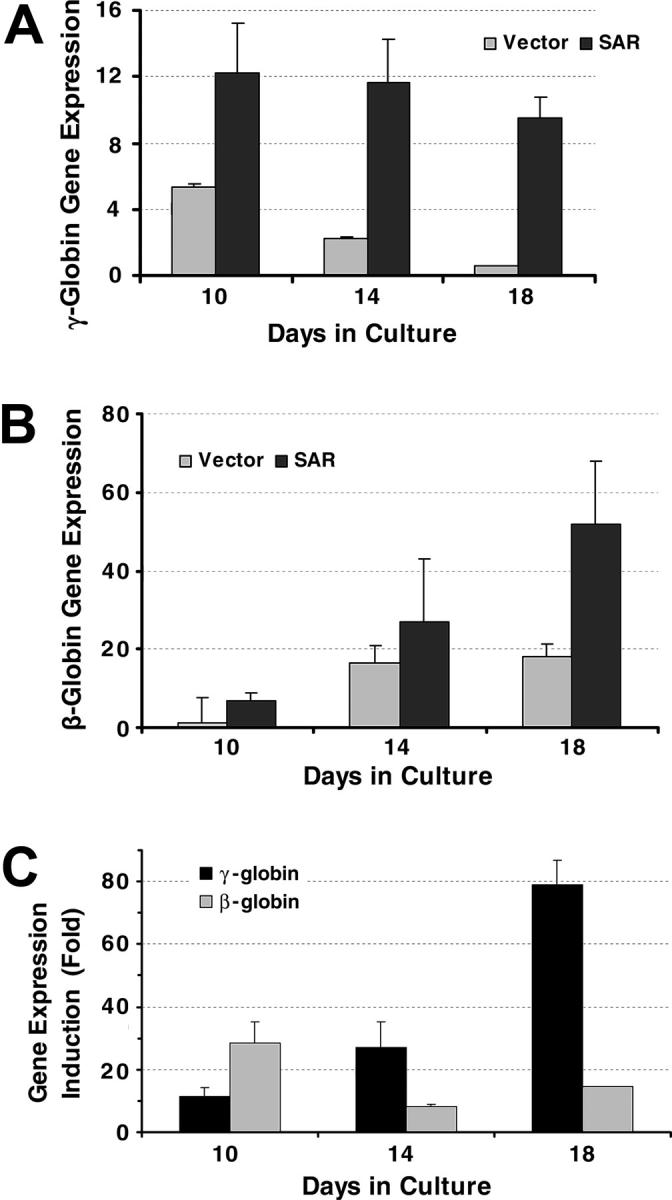
γ-globin and β-globin gene transcription in CD34+ cells determined by real time PCR. (A) γ-globin gene expression in CD34+ cells infected with an SAR retrovirus and vector control cells, normalized with β-actin gene. (B) β-globin genes expression in CD34+ cells infected with an SAR retrovirus and vector control cells, normalized with β-actin gene. (C) Comparison of SAR effect on γ-globin and β-globin genes in SAR-expressing CD34+ cells, shown as fold increase compared with vector control cells. Error bars indicate standard deviation of the mean of 3 independent experiments.