Figure 2.
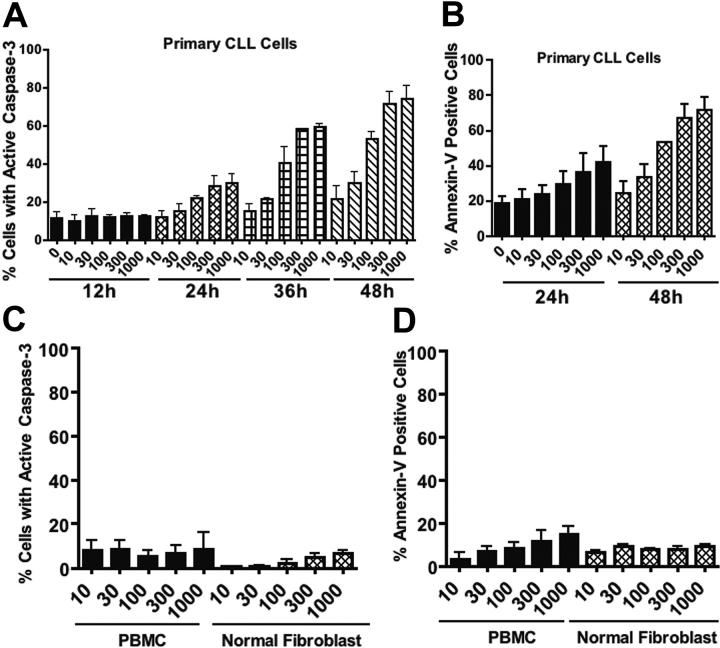
Time- and concentration-dependent induction of apoptosis by brefeldin A in primary CLL cells in comparison with normal cells. (A-B) Time course of apoptosis induction by various concentrations of brefeldin A in primary CLL cells. Drug-induced apoptosis was quantitated by flow cytometric analysis of caspase-3 activation (A) and annexin V-FITC/PI double-staining (B). n = 3; error bars indicate SEM. (C-D) Normal human peripheral blood mononuclear cells (PBMCs) and fibroblasts were treated with the indicated concentrations of brefeldin A for 48 hours. Drug-induced apoptosis was quantitated by flow cytometric analysis of caspase-3 activation (C) and annexin V-FITC/PI double-staining (D). Error bars indicate the SEM.

