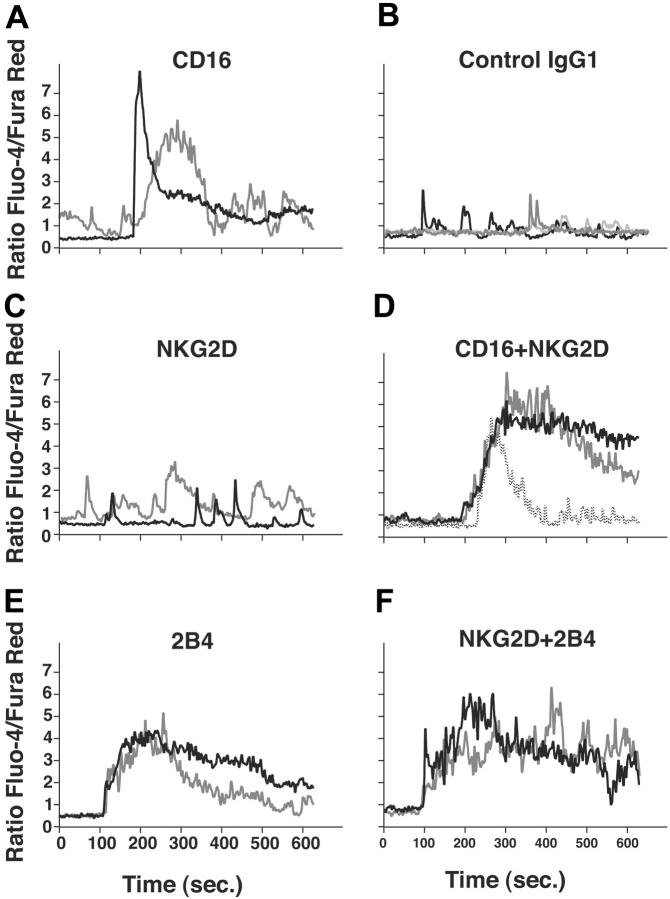
Figure 4.
Single-cell Ca2+ flux analysis. (A-F) Resting NK cells were loaded with Fluo-4 and Fura Red, placed on coverslips, and stained with antibodies as indicated. Cells were washed, resuspended in HBSS 1% FBS, and prewarmed at 37°C. Fluorescence was measured by confocal microscopy. Thirty seconds after the beginning of each scan, secondary F(ab′)2 goat anti-mouse IgG was added to each sample. Traces of the Fluo-4/Fura Red ratio of 2 or 3 representative NK cells are shown.

