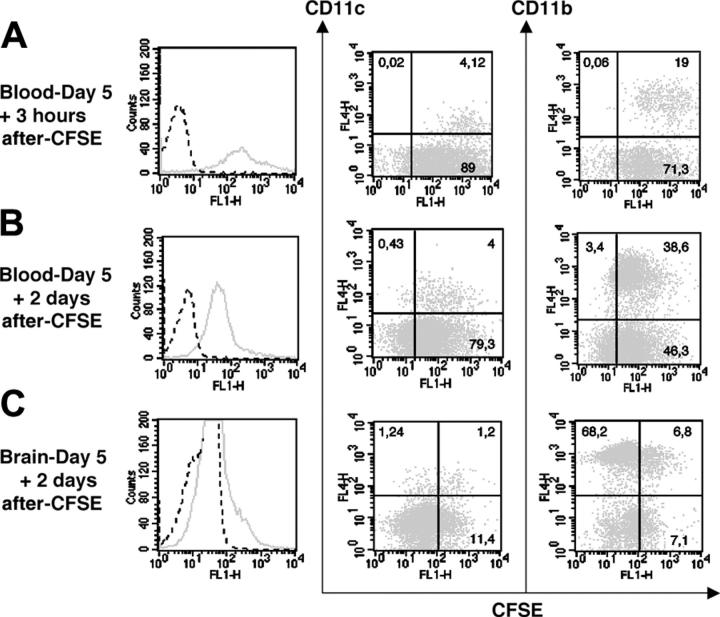
Figure 5.
CFSE IV injection (0.72 mg/animal) in 5 day–infected C57BL/6 mice. CFSE fluorescence expressed by blood cells 3 hours (A) and 2 days (B) after dye injection. (C) CFSE fluorescence expressed by brain leukocytes 2 days after dye injection. Histograms represent the total of CFSE+ cells (solid line) and fluorescence measured after PBS-DMSO injection is shown as a dot line. Dot plots indicate the percentages of CD11c+CFSE+ and CD11b+CFSE+ cells present in the blood and the brain after the dye injection. Cells of 3 mice were pooled. The data shown are from a single experiment, representative of 2 separate experiments. Noninfected mice also received CFSE for control (data not shown).

