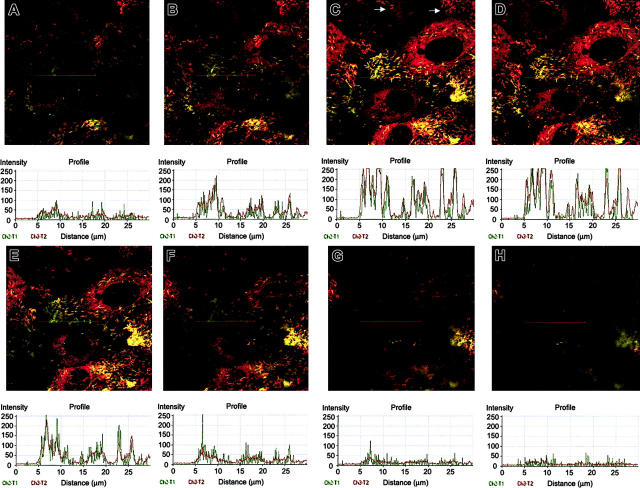
Figure 6.
Sequential imaging of HUVECs immunostained for P-selectin and VWF. Shown starting at the apical surface (A-H) and extending to the basal surface imaged every 0.5 μm are z-sections of merged images depicting colocalization of VWF and P-selectin. Histograms were generated using the profile feature in the Zeiss LSM image browser and represent the colocalization of P-selectin and VWF when graphed objectively through the red line. Note that when certain granules appear to be composed of entirely P-selectin (green) and when examined objectively, there is underlying VWF (red). Examination of at least 6 to 8 additional fields yielded similar results. Images were obtained by viewing through a × 63 objective.

