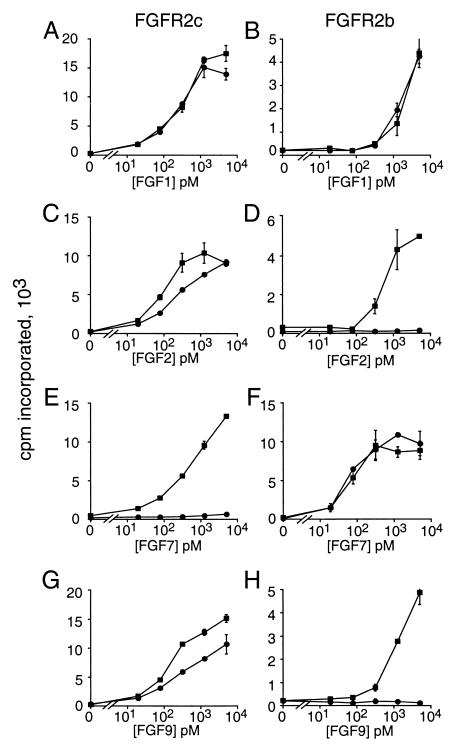
Figure 3.
Mitogenic activity of BaF3 cells expressing wild-type FGFR2 (circles) and S252W mutant FGFR2 (squares) after treatment with different FGFs. (A, C, E, and G) Comparison of wild-type and mutant FGFR2c. (B, D, F, and H) Comparison of wild-type and mutant FGFR2b. Each stably selected polyclonal cell pool was treated with FGF1, FGF2, FGF6 (not shown), FGF7, FGF9, and FGF10 (not shown), as indicated.

