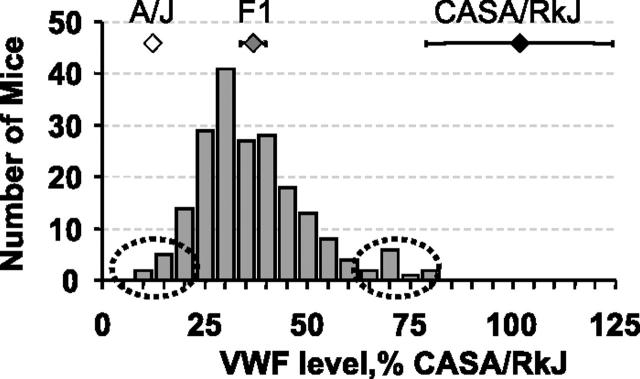
Figure 2.
Distribution of plasma VWF levels in 200 (A/J × CASA/RkJ) F2 mice. VWF levels were calculated as a percentage of the CASA/RkJ parental strain. The latter is arbitrarily defined as 100%. F2 values are summarized by the bar graph. Averages for the parental and F1 populations (± SD) are shown: A/J (open diamond), CASA/RkJ (black diamond), and F1 (gray diamond). Samples selected for high and low pools are indicated by the dotted ovals.

