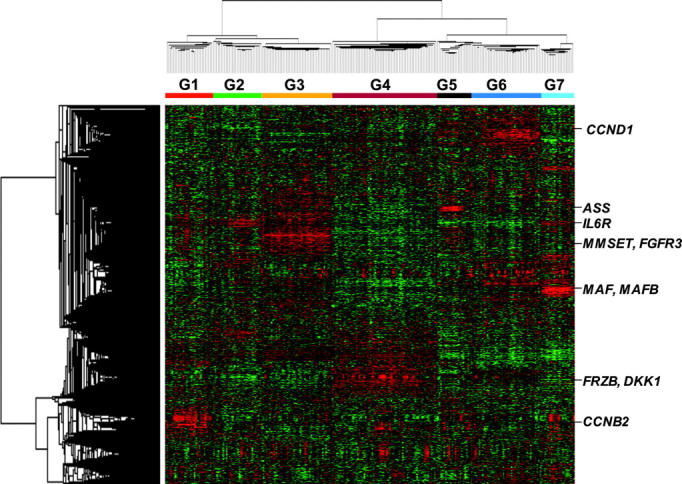
Figure 1.

Gene expression patterns in malignant plasma cells reveals that myeloma consists of 7 subgroups. Two-dimensional unsupervised hierarchic cluster analysis of 1559 highly variable genes (rows) in CD138-enriched plasma cells from 256 newly diagnosed multiple myeloma cases (columns). A mean-centered gene expression is depicted by a normalized-signal pseudocolor scale. Red and green indicate overexpressed and underexpressed genes, respectively. The sample dendrogram at the top and gene dendrogram to the side reflect the relatedness of the samples. Note that the dendrogram branches are strongly influenced by noticeable clusters of overexpressed genes. Subgroup designations 1 through 7, from left to right, are indicated under the dendrogram. Subgroup-specific gene clusters are indicated by colored bars to the right of the dendrogram.
