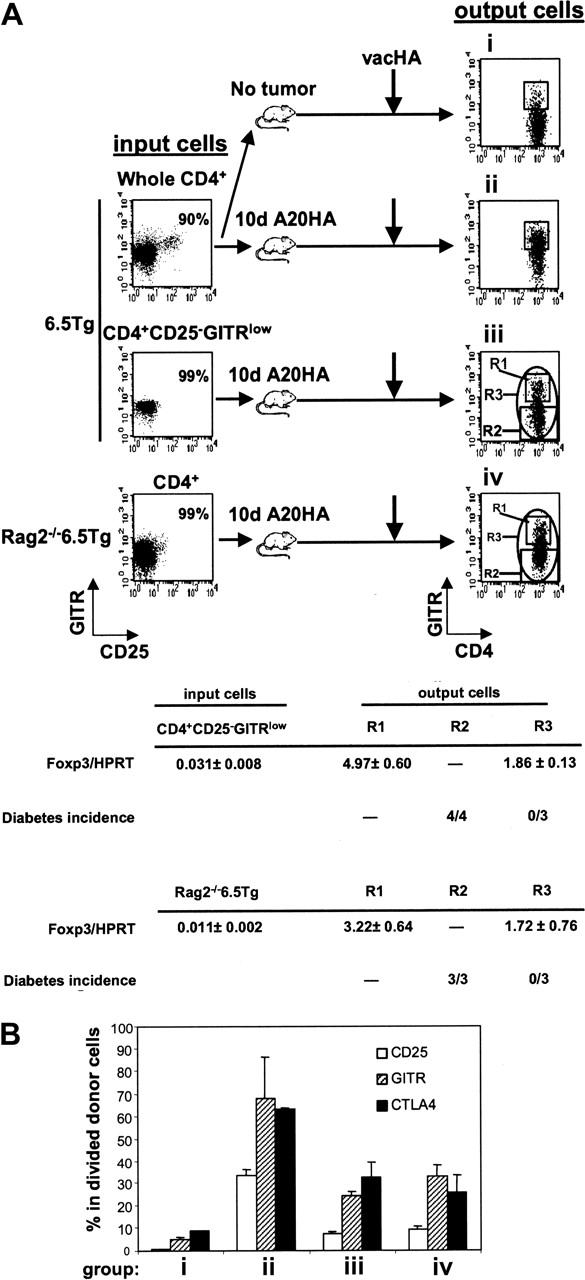
Figure 6.

Induction of TMTregs in TM mice is independent of pre-existing natural Tregs. (A) Enriched CD4+ T cells (whole CD4+) from 6.5 Tg mice were labeled with CFSE and transferred into mice without tumor (group i) or with a 10-day A20HA tumor burden (group ii). Alternatively, sorted CD4+CD25– GITRlow cells from 6.5 Tg mice or CD4+ from Rag2–/– 6.5 Tg mice were labeled with CFSE and transferred into TM mice (groups iii and iv, respectively). An aliquot of the sorted donor cells was stained for expression of CD4, CD25, and GITR to evaluate their purity and RNA was isolated for qRT-PCR. Fourteen days after transfer, all recipients received vacHA, and responses were analyzed 5 days later. Spleen cells were stained for expression of CD4, TCR clonotype, and GITR. Plots shown were gated on divided donor cells. Cells were sorted based on the indicated gating regions (R1, R2, or R3). qRT-PCR analysis of Foxp3 mRNA was performed on sorted cells and the relative mRNA frequencies of Foxp3/HPRT are listed. The function of the sorted cells was tested by transferring them into Rag2–/– Ins-HA mice and monitoring diabetes development. Each mouse received either 50 000 cells sorted from the R2 region (CFSElow GITRlow), or cells from the R3 region (CFSElow GITR-unfractionated). Diabetes induction was monitored during a 30-day period. The incidence of diabetes is listed in Table 1. (B) Percentage of donor cells expressing CD25, GITR, and CTLA4 at the time of analysis as determined by FACS analysis. Each group had 3 mice. Results are shown as mean ± SE.
